Begin
14 pages · ~28 min
Introduction to GIS: Layers and Spatial Questions
This introductory GIS training teaches learners to work with layers and spatial data and to ask and answer spatial questions. It is designed for beginners new to GIS concepts.
A digital instructor presents all 14 pages. Hold “Ask” at any point and ask out loud — the answer comes from this course. No sign-up needed.
What you’ll learn
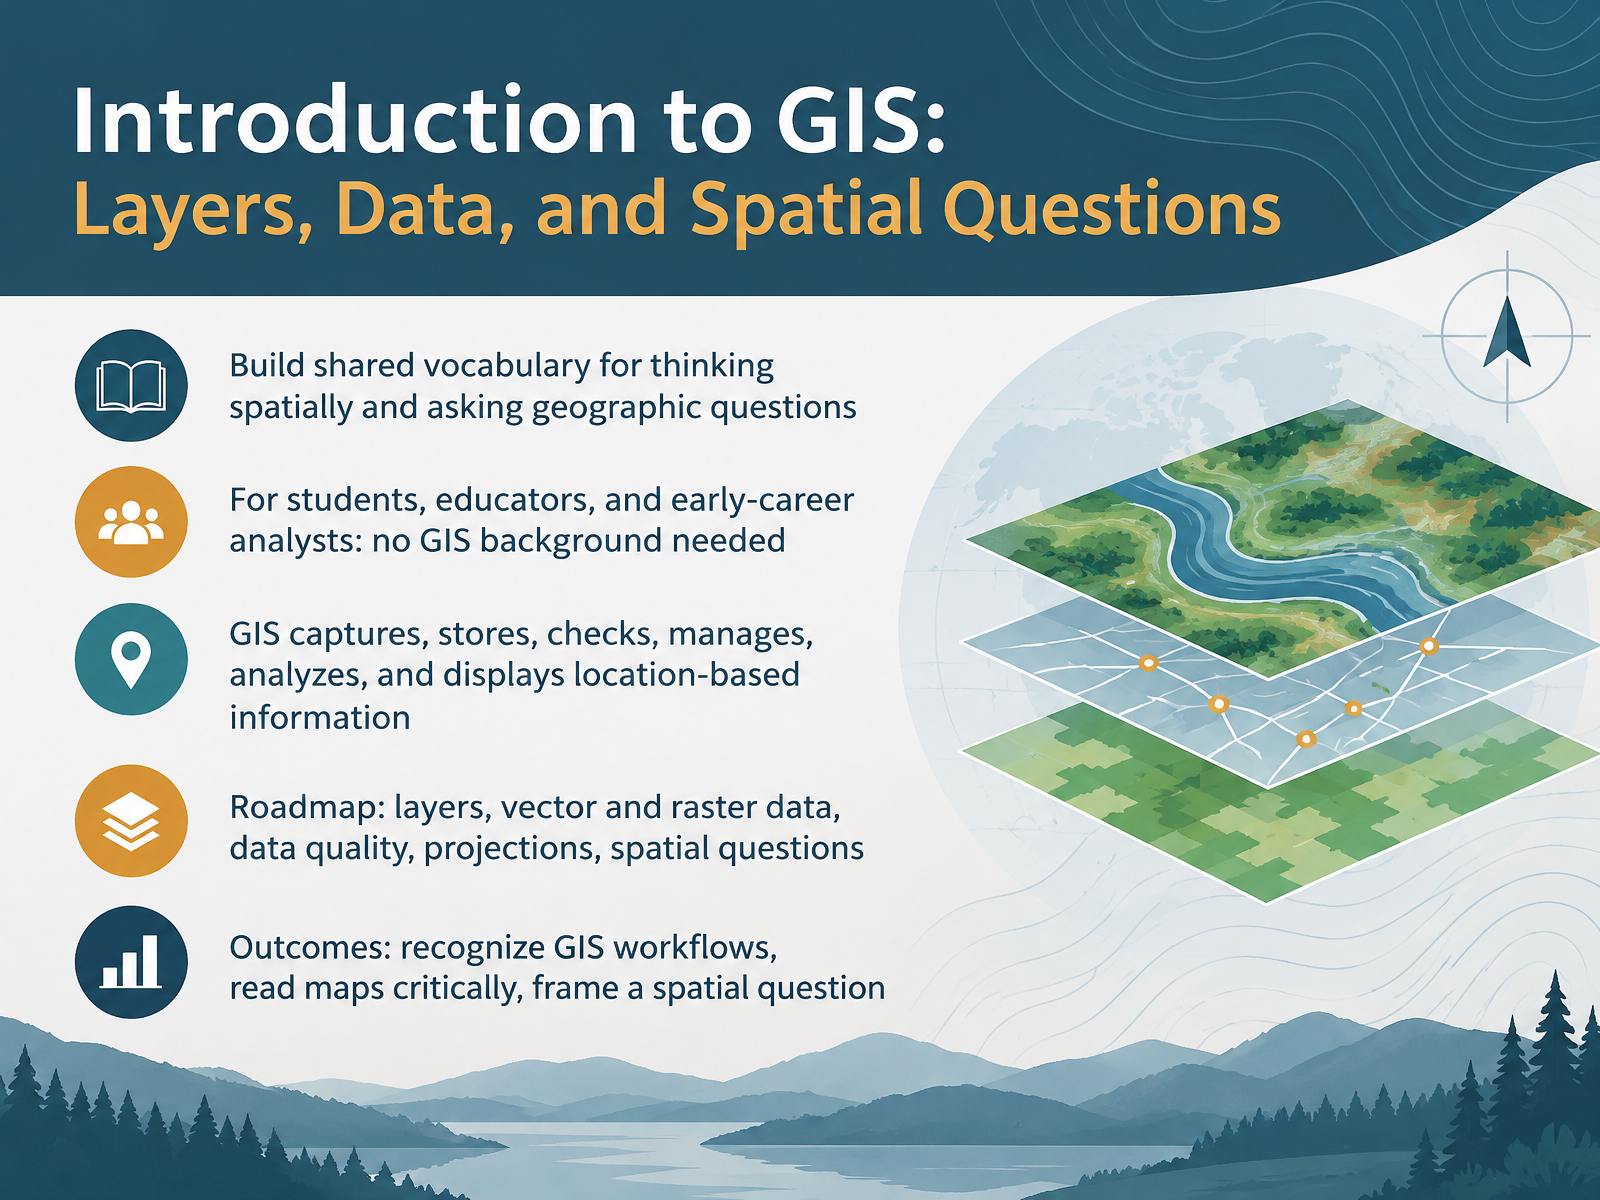
- 01Introduction to GIS: Layers, Data, and Spatial QuestionsWelcome. I'm glad you're here, because this course is about seeing the world in a new way. A geographic information system, or GIS, is a computer system that captures, stores, checks, manages, analyzes, and displays information tied to locations on Earth. That's a mouthful, so think of a city's fire hydrant map. The map shows where each hydrant sits, and the data says when it was last inspected. By the end, you'll have a shared vocabulary for thinking spatially. You'll recognize common GIS workflows, read maps more critically, and frame your own spatial question. No GIS background is needed. If the jargon feels like too much at first, that's completely normal. Here's why that matters. You don't need to master every tool to ask good geographic questions. In our next part, we'll build the foundation of spatial thinking. Why Location Matters, Spatial Thinking Foundations.en.wikipedia.orgusgs.govesri.com+22 min
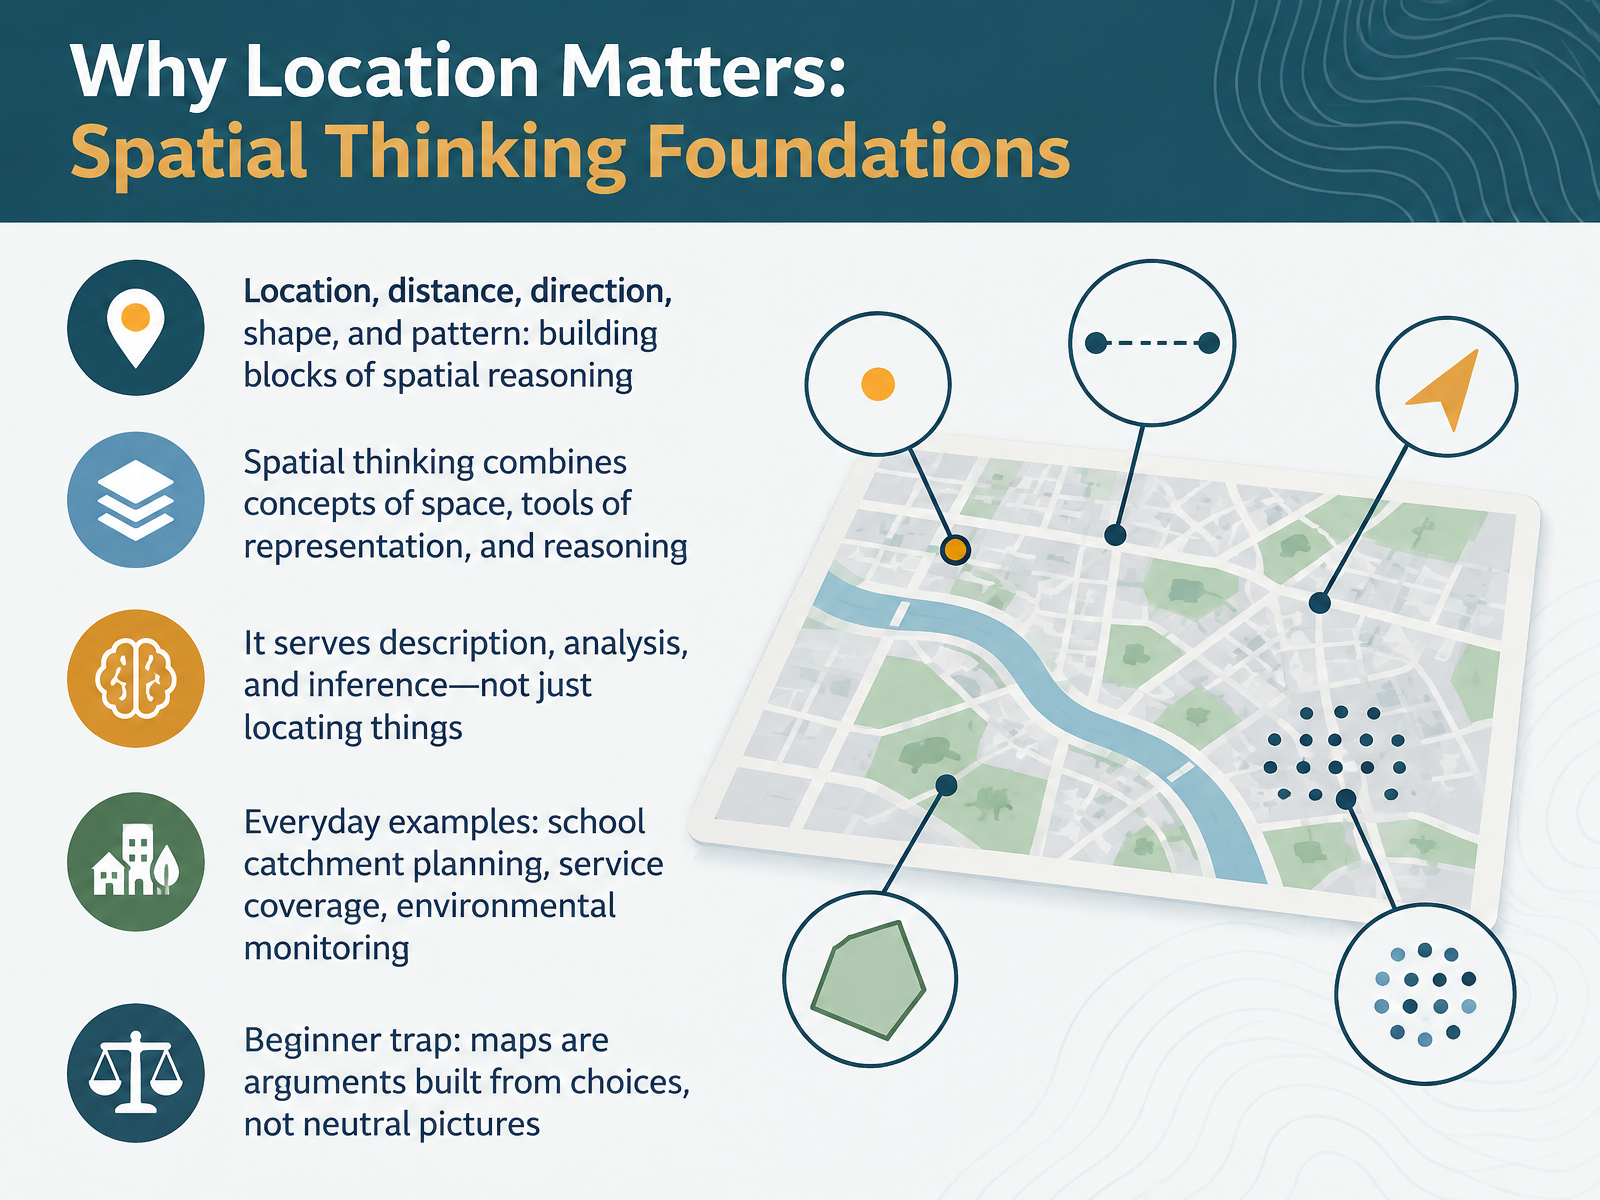
- 02Why Location Matters: Spatial Thinking FoundationsLet's build the foundation for spatial thinking. At its core, spatial reasoning rests on five concepts: location, distance, direction, shape, and pattern. Spatial thinking combines ideas about space, tools like maps and graphs, and reasoning. Here's why that matters. It does more than locate things. It helps us describe, analyze, and even infer what might happen next. Take school catchment planning: drawing boundaries affects which children attend which school. Service coverage asks whether a clinic can reach enough people. Environmental monitoring tracks changes in air or water over a region. One beginner trap worth naming: a map is not a neutral picture. It is an argument built from choices about what to show, what to hide, and how to classify. If that feels like a lot, that's normal. Confusion now is part of learning. Next, we'll look at maps as arguments and how to read layers critically.
 geography.org.ukdoi.orgdigital.library.txst.edu+22 min
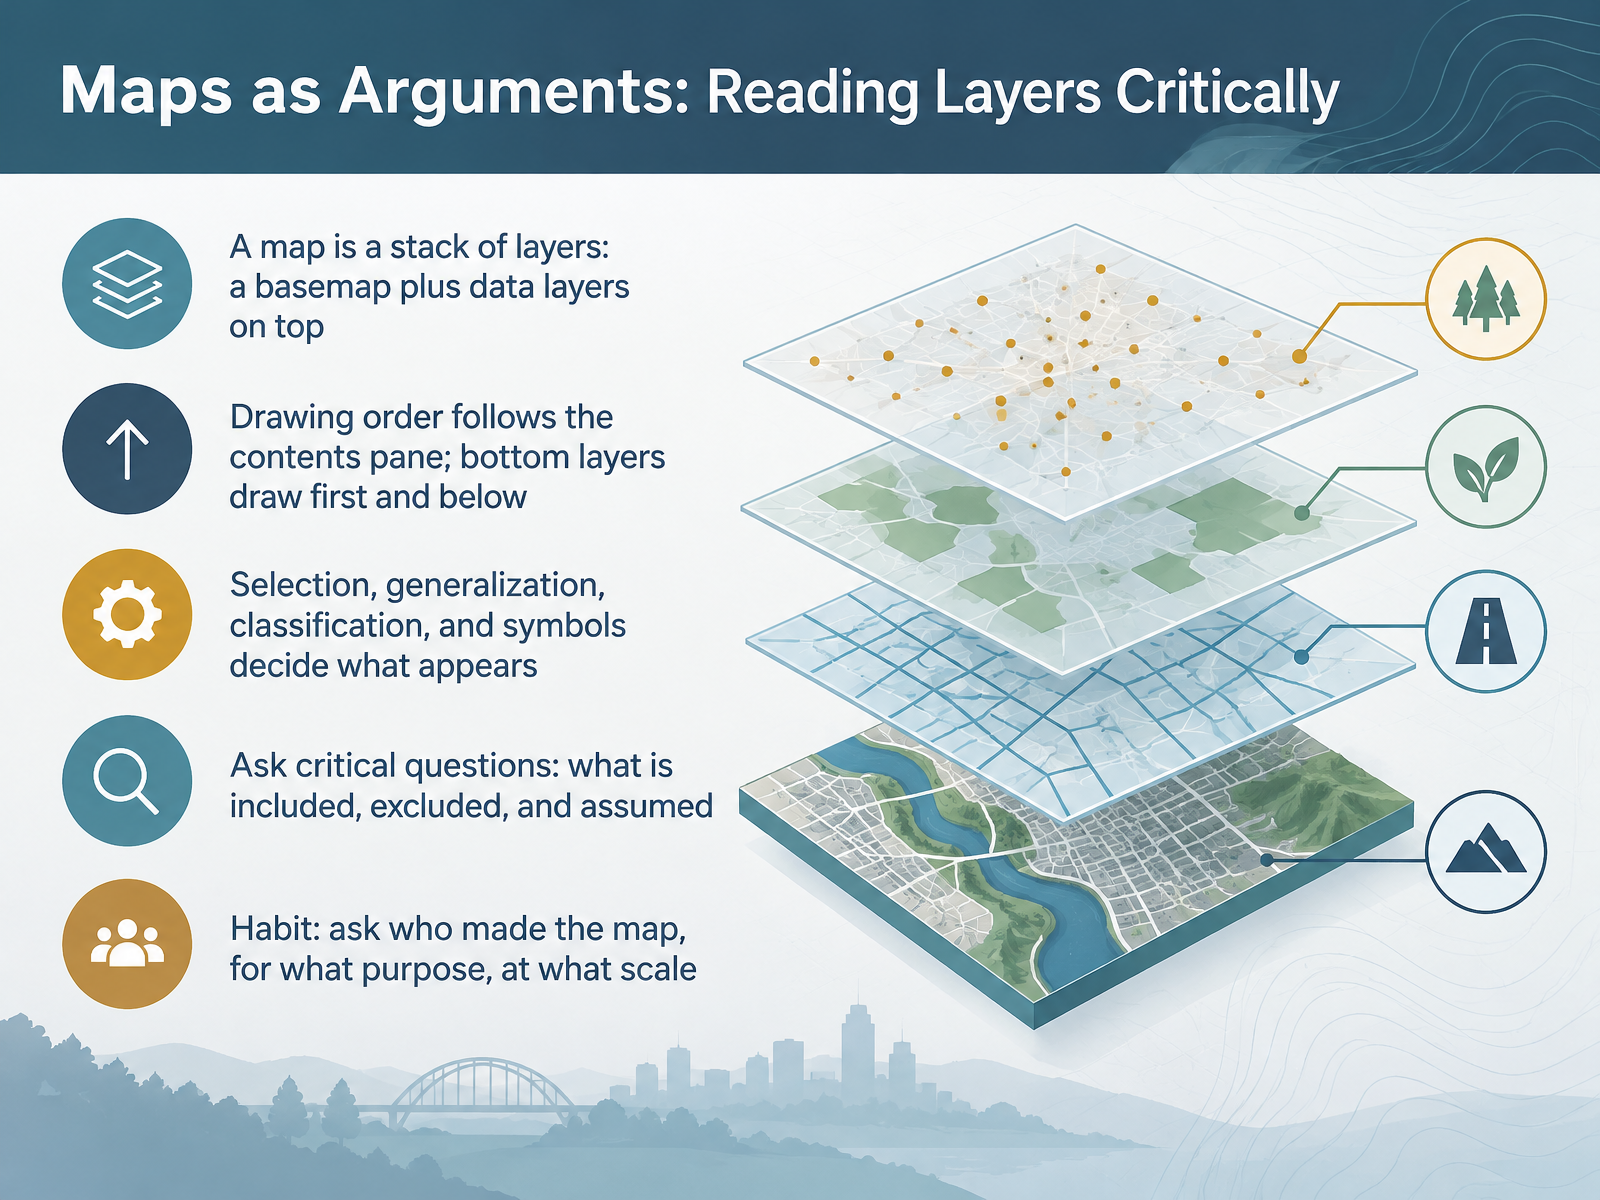
- 03Maps as Arguments: Reading Layers CriticallyNext, let's talk about reading maps critically. A map is really a stack of layers. Think of a street map with bus routes drawn over it. The basemap, the background reference map, sits underneath, and data layers sit on top. Drawing order follows the contents pane. Layers at the bottom draw first and appear beneath the layers above them. Now, here's why that matters. Selection, generalization, classification, and symbols all decide what actually appears. So ask critical questions. What is included, what is excluded, and what is assumed? A simple habit helps. Ask who made the map, for what purpose, and at what scale. Confusion about what to trust is normal at this stage. Just keep asking. The GIS Layer Stack: Basemaps and Feature Layers.
 doc.esri.comdoc.esri.comdoc.esri.com+22 min
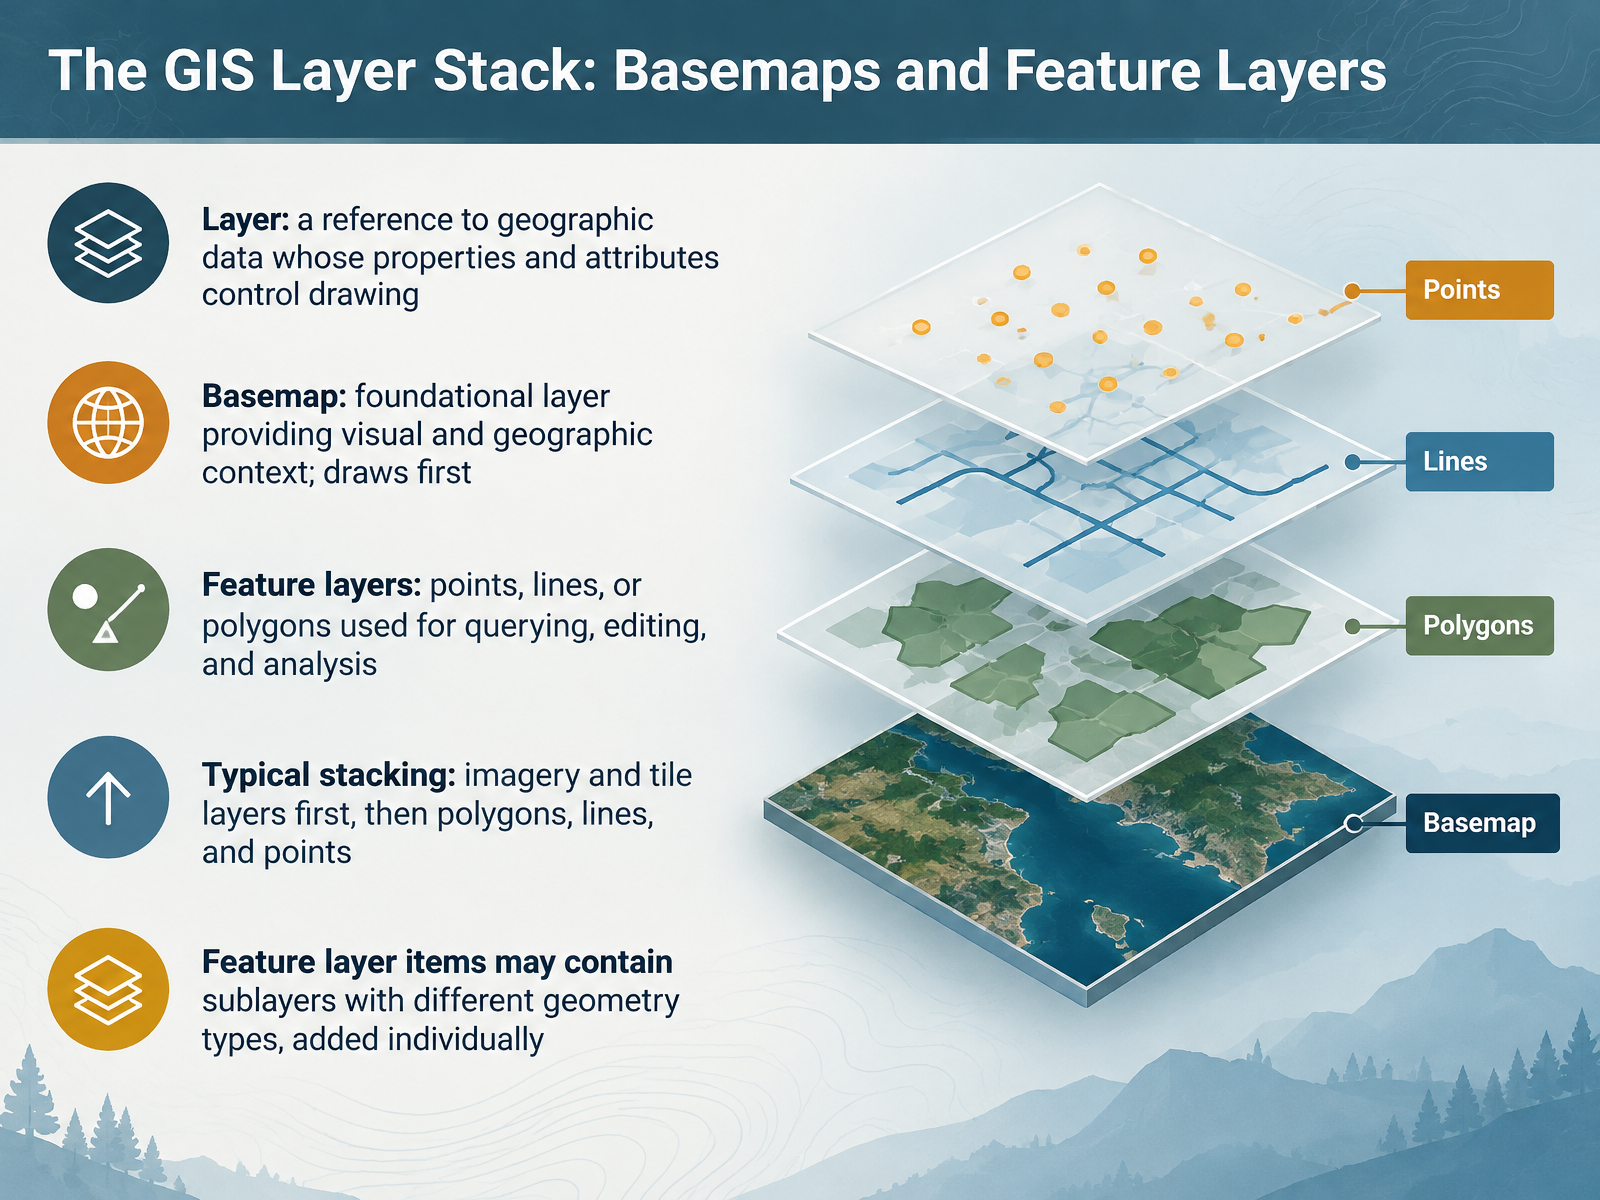
- 04The GIS Layer Stack: Basemaps and Feature LayersNow let's look at the GIS layer stack. A layer is simply a reference to geographic data. Its properties and attributes control how that data draws on your map. Think of a weather map on the evening news. The coastline is your basemap, the foundational layer that provides visual and geographic context, and it draws first. On top sit feature layers: points, lines, or polygons you use for querying, editing, and analysis. A city boundary polygon is one example. Here's why that matters. The typical stacking order is imagery and tile layers first, then polygons, then lines, then points, so nothing important gets buried. One detail to remember. A single feature layer item may contain sublayers with different geometry types, such as trees as points and trails as lines. Add those sublayers individually. If the jargon feels like a lot right now, that's normal. Next, we'll see how symbology, order, and transparency help layers communicate.
 doc.esri.comdoc.esri.comdoc.esri.com+22 min
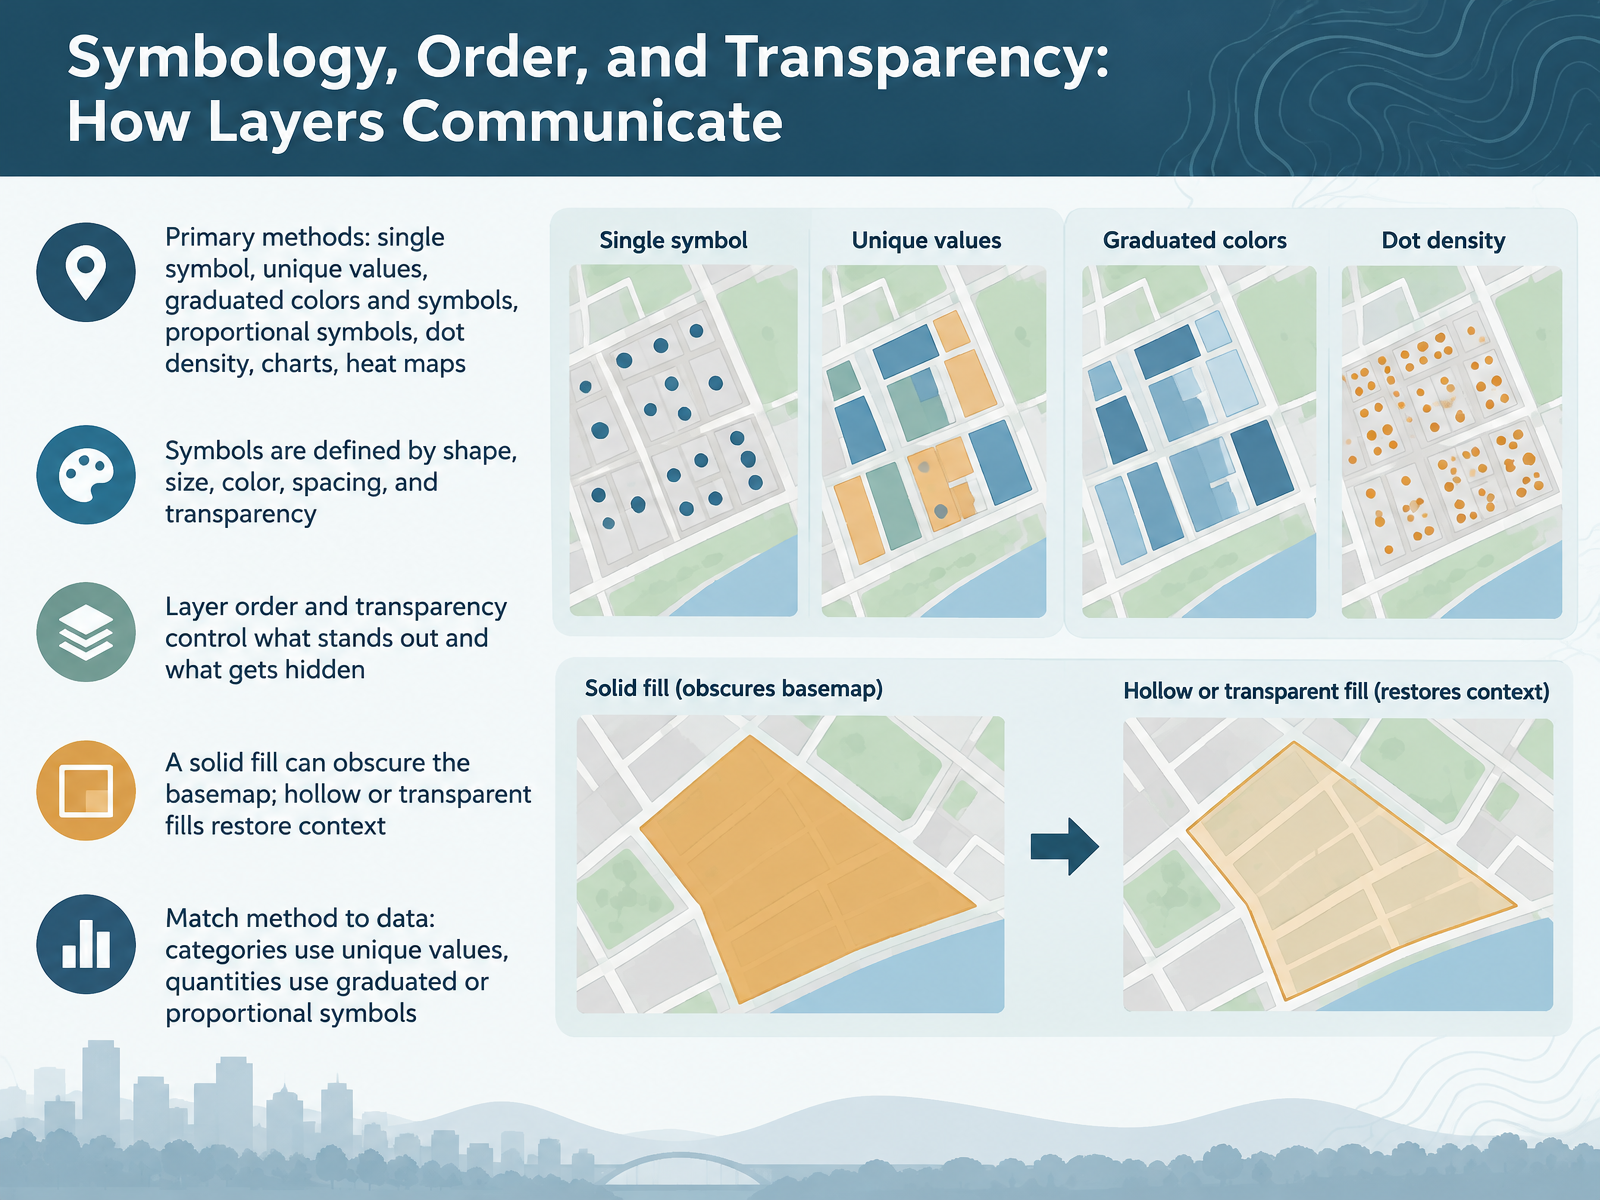
- 05Symbology, Order, and Transparency: How Layers CommunicateNow let's look at symbology, which is simply how symbols represent your data on a map. You have several options. Single symbol draws everything the same way. Unique values give each category its own symbol, while graduated colors and graduated symbols show quantities through color ranges or size. Proportional symbols scale size directly to a value, dot density spreads points inside polygons, charts show multiple values at once, and heat maps reveal point density. Every symbol is built from shape, size, color, spacing, and transparency. Here's why that matters. Layer order and transparency decide what stands out and what gets hidden. A solid fill can bury the basemap underneath. A hollow or transparent fill brings that context back. If choosing feels overwhelming, that's normal. A simple rule helps. Match categories to unique values, and quantities to graduated or proportional symbols. Next, we move on to two ways to represent the world: vector and raster.
 doc.esri.comdoc.esri.comdoc.esri.com+22 min
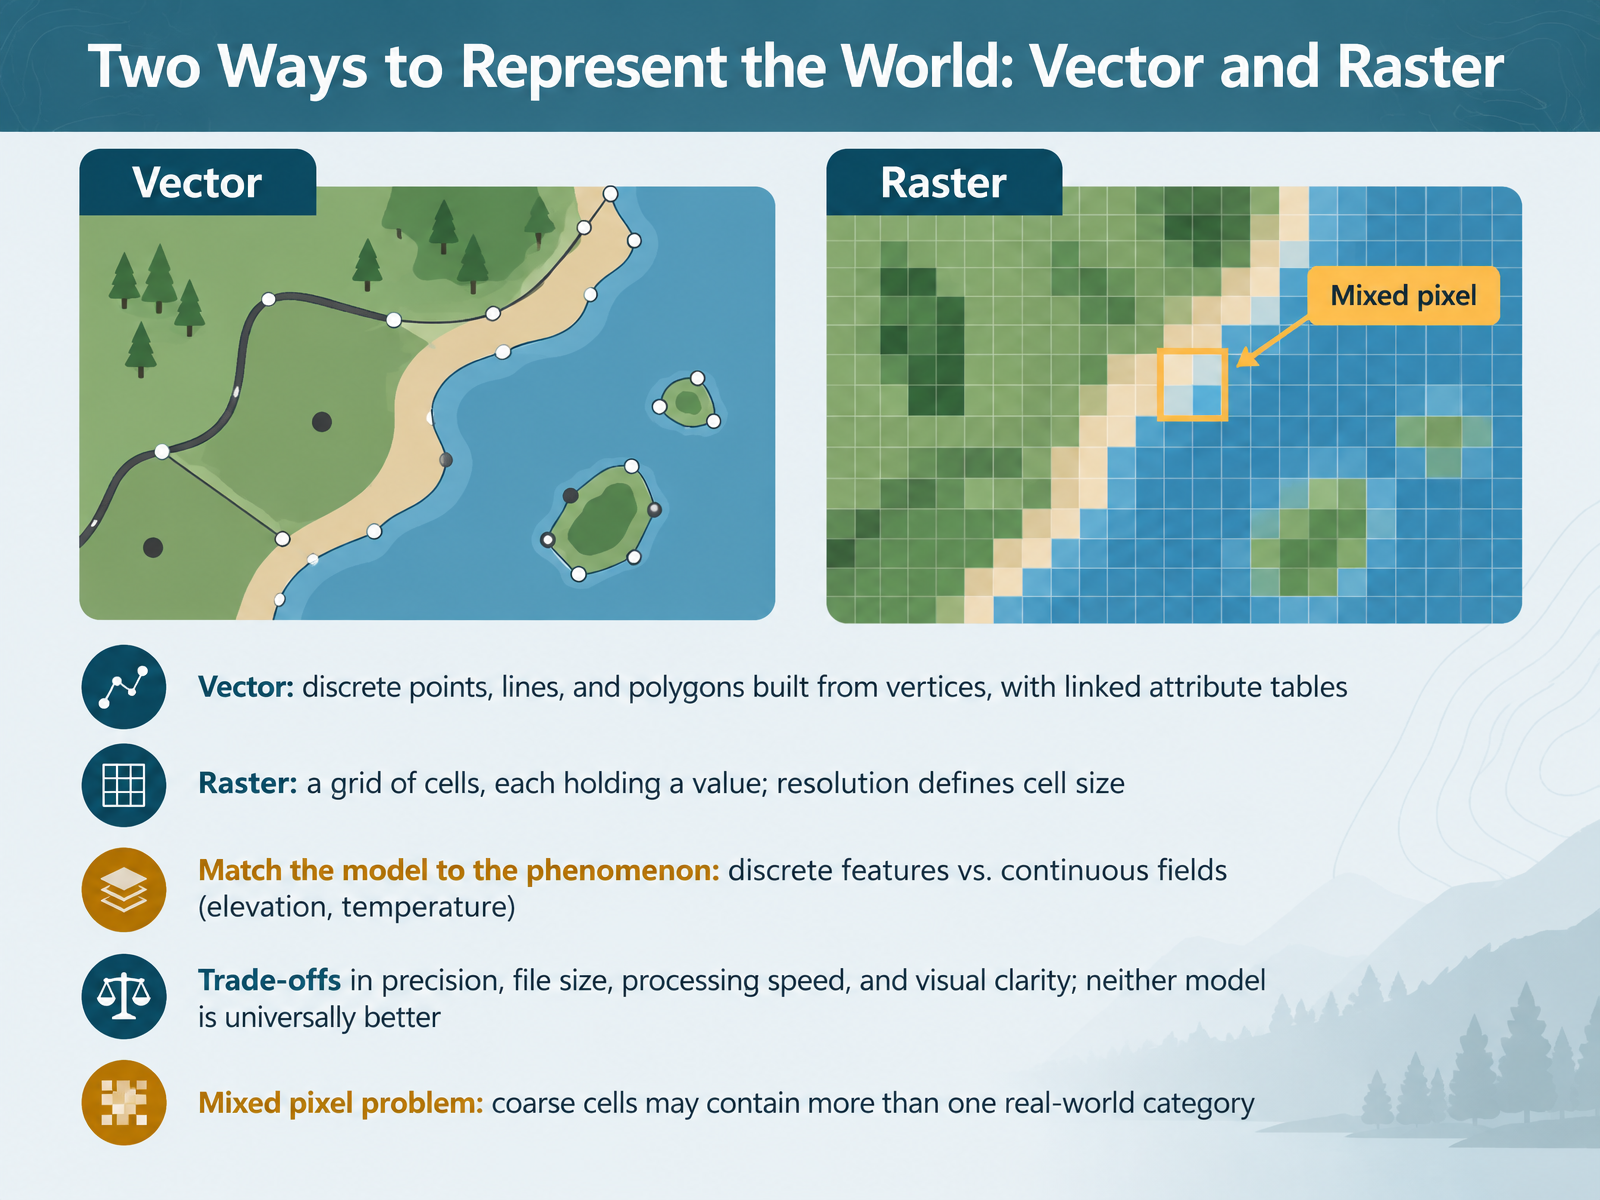
- 06Two Ways to Represent the World: Vector and RasterSo far we've stored locations. Now let's look at two ways to represent the world: vector and raster. Vector data uses discrete points, lines, and polygons. Each shape is built from vertices, which are simply corner points, and each is linked to an attribute table. Think of a map to your house: roads as lines, your house as a point. Raster data is a grid of cells, and each cell holds a value, like elevation or temperature. Resolution defines cell size. Here's why that matters. Match the model to the phenomenon. Discrete features suit vector. Continuous fields like elevation suit raster. Neither model is universally better. There are trade-offs in precision, file size, processing speed, and visual clarity. One common beginner concern is the mixed pixel problem. A coarse cell may contain more than one real-world category, like both park and water. If that feels confusing, it's normal. Next, we'll look at attributes and the link between geometry and data.
 geo.libretexts.orgguides.geospatial.bas.ac.ukucdavisdatalab.github.io+22 min
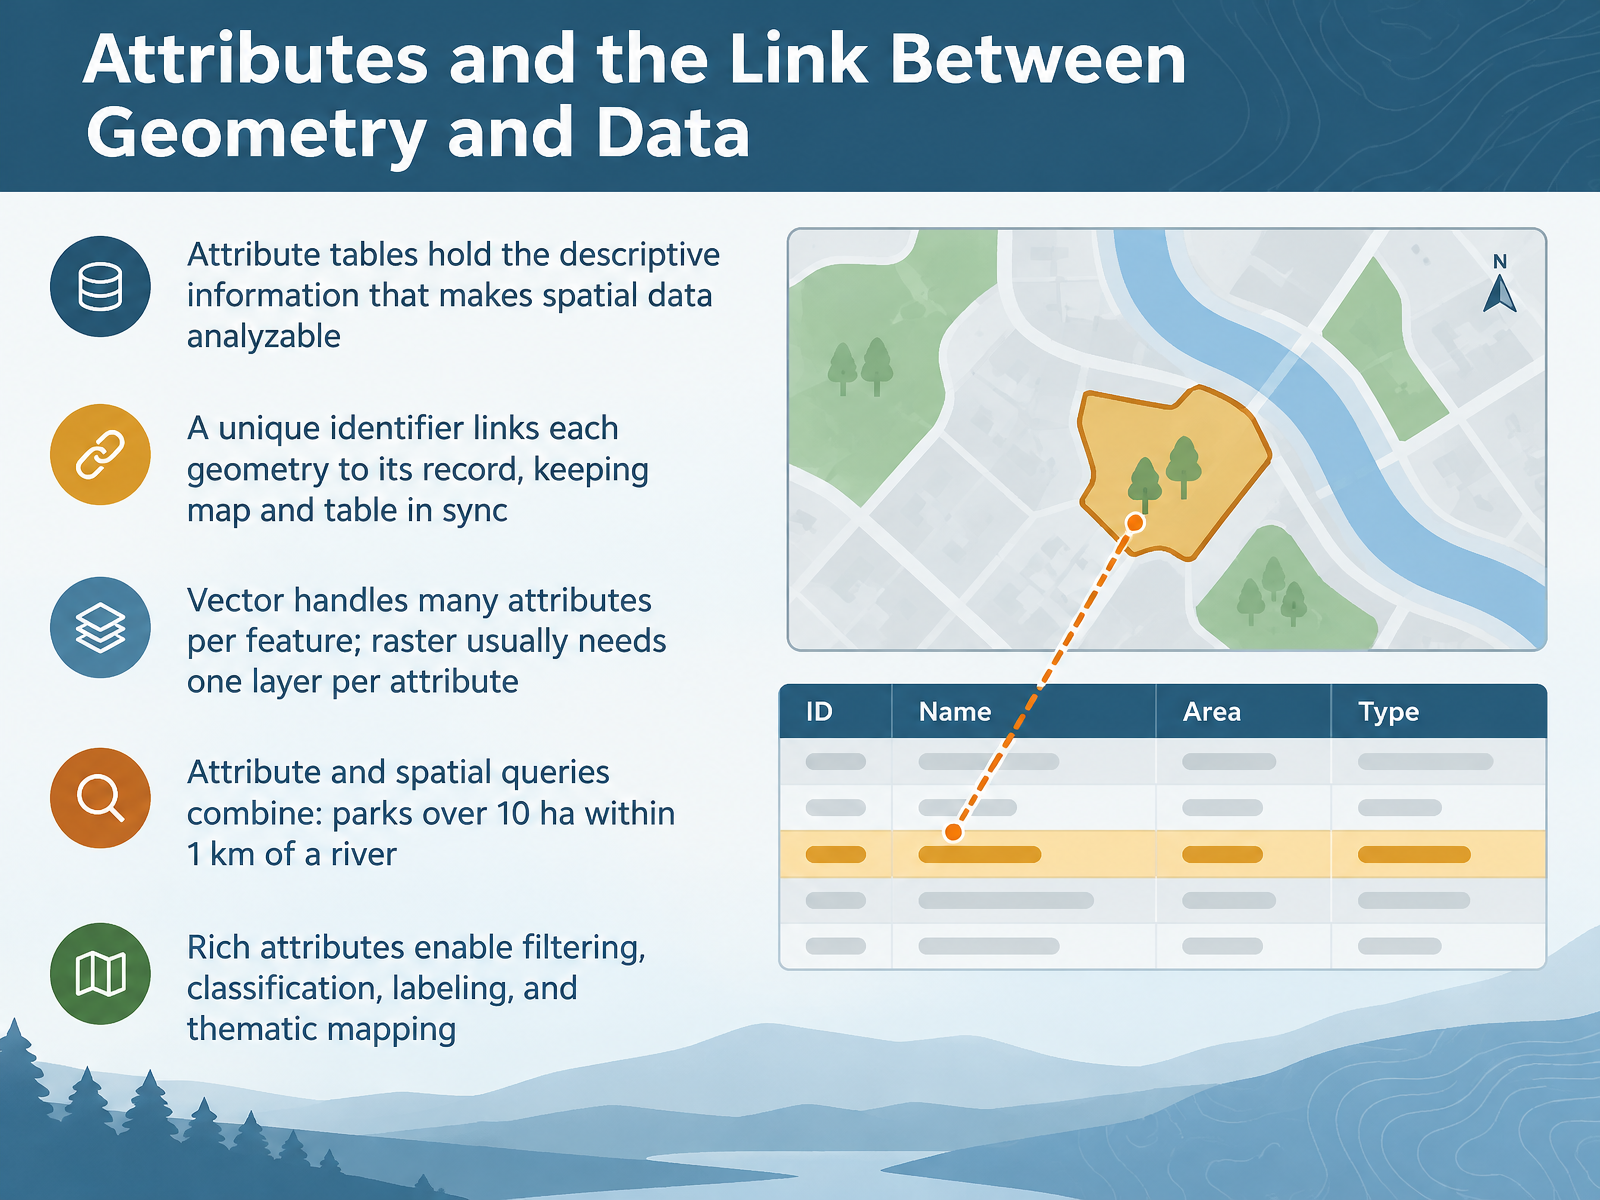
- 07Attributes and the Link Between Geometry and DataNow let's talk about attributes, and how geometry connects to data. An attribute table holds the descriptive information that makes spatial data analyzable. Think of it like a contacts list: the map shows where something is, and the table tells you what it is. A unique identifier links each geometry to its record, keeping the map and table in sync. Here's why that matters. Vector data handles many attributes per feature, like a park's name, size, and opening hours. Raster usually needs one layer per attribute, so extra detail means extra layers. You can also combine attribute and spatial queries. For example, find parks over ten hectares within one kilometer of a river. Rich attributes let you filter, classify, label, and build thematic maps. If the jargon feels heavy right now, that's normal. Next, we'll look at where data comes from: sources and metadata.
 geo.libretexts.orgguides.geospatial.bas.ac.ukucdavisdatalab.github.io+22 min
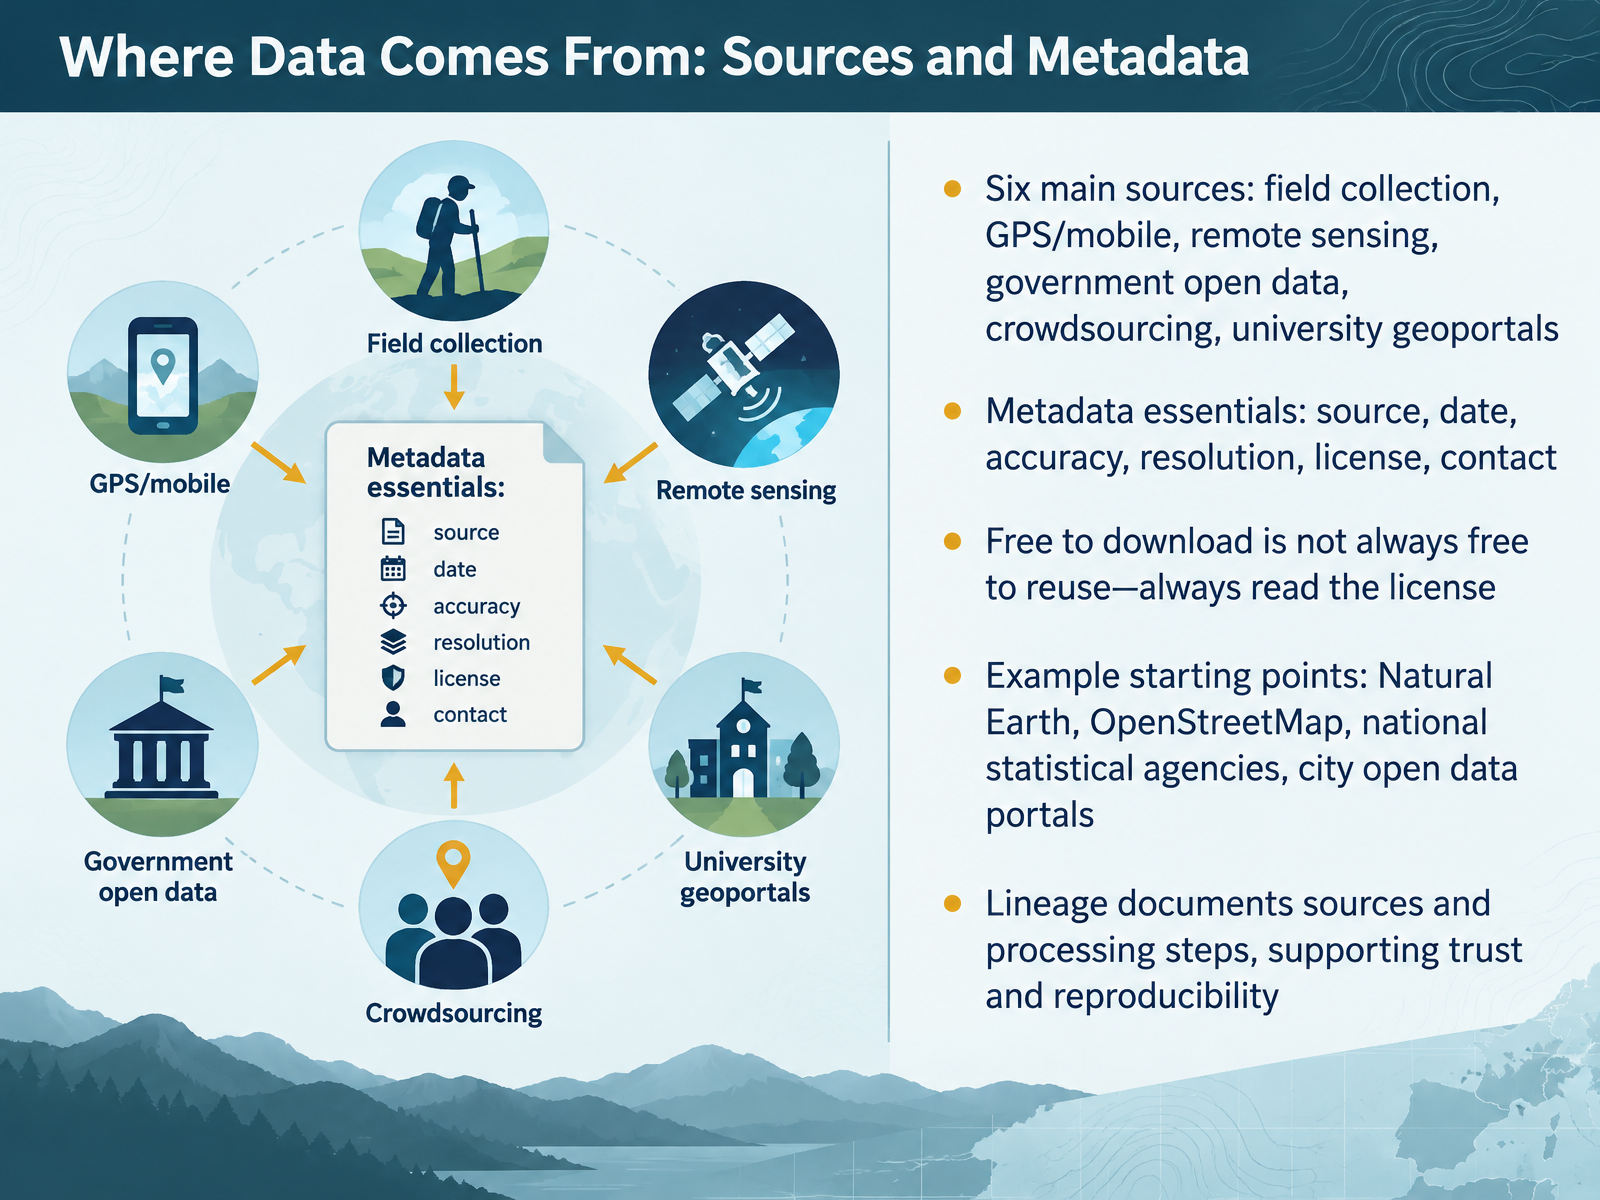
- 08Where Data Comes From: Sources and MetadataNow let's talk about where all this data actually comes from, and how to judge it before you trust it. There are six common sources: field collection, GPS and mobile devices, remote sensing from satellites, government open data, crowdsourcing, and university geoportals. Here's what matters. Every layer comes with metadata, which simply means data about the data. Look for the source, the date, the accuracy, the resolution or level of detail, the license, and a contact. One thing catches many beginners: free to download does not always mean free to reuse. Always read the license. Good places to start include Natural Earth for global layers, OpenStreetMap for streets and buildings, and national statistical agencies and city open data portals for local detail. Finally, look for a lineage statement. Lineage documents the original sources and the processing steps, which supports trust and reproducibility. If choosing a layer feels overwhelming, that's normal. Start with one dataset and read its metadata closely. Next, we'll ask: how good is the data? Quality and fitness for purpose.
 2 min
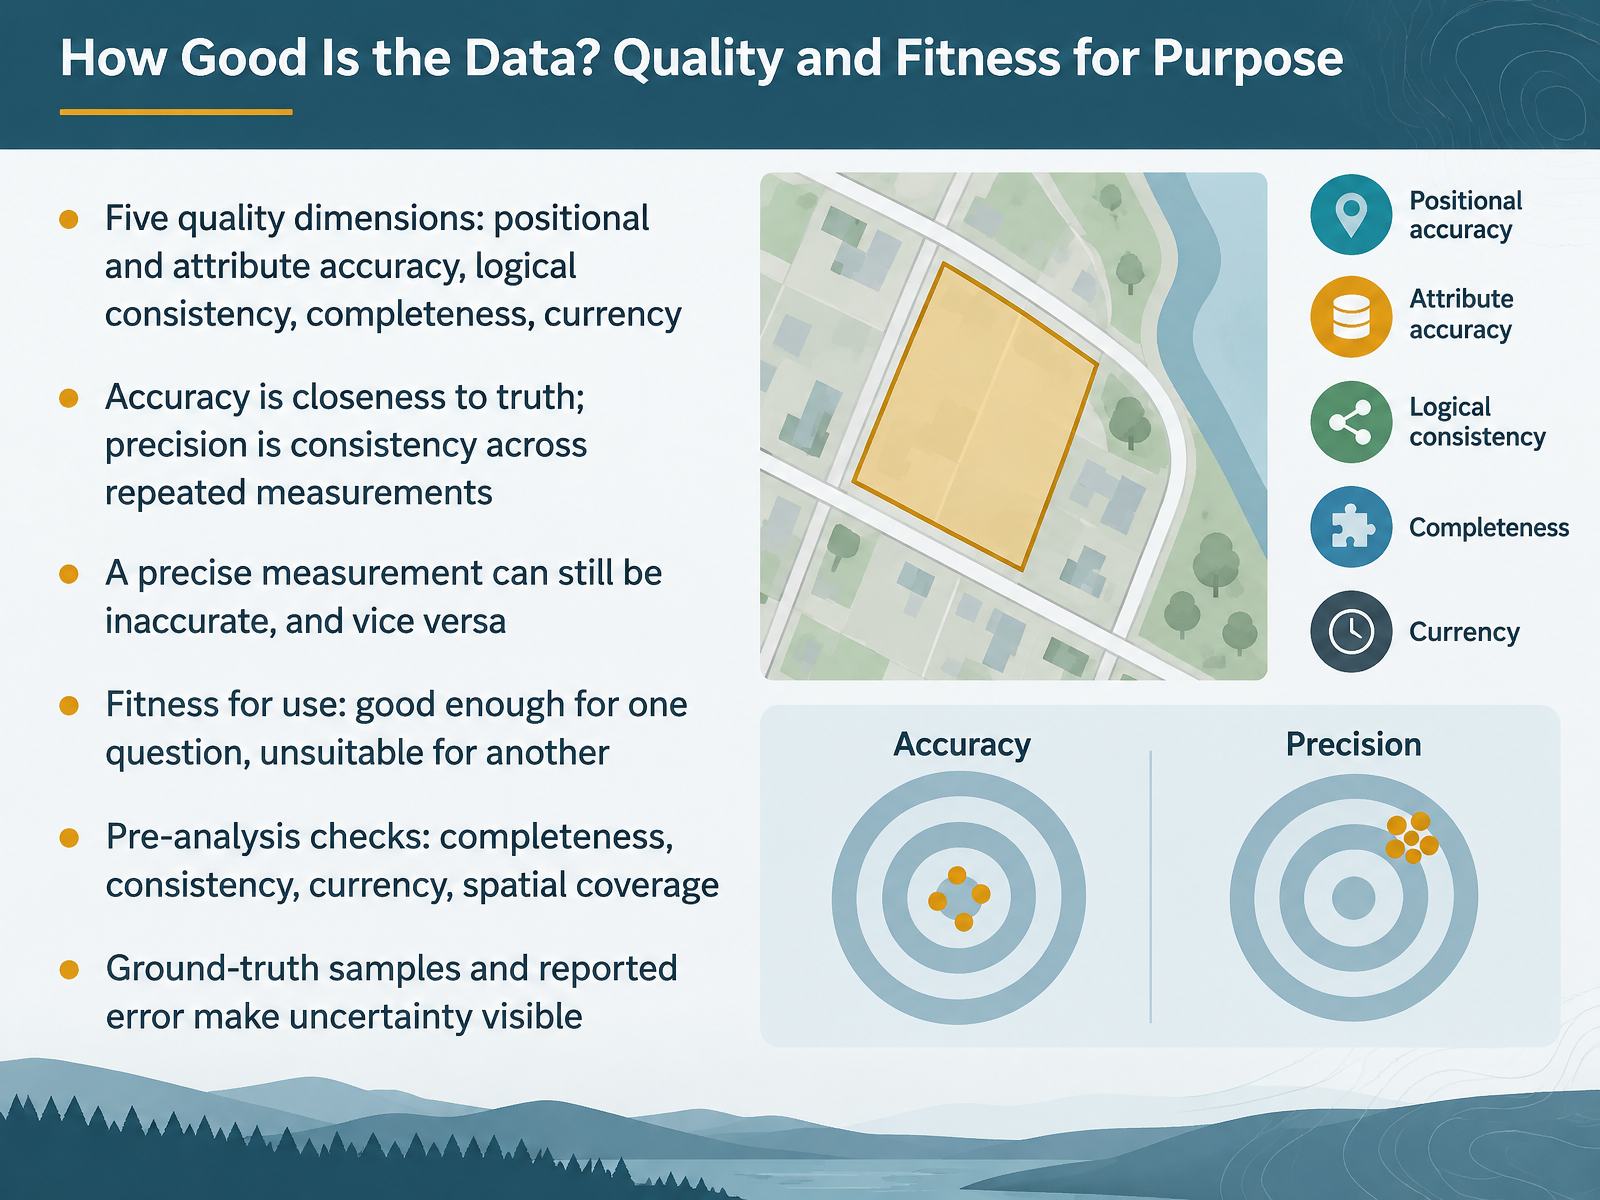
- 09How Good Is the Data? Quality and Fitness for PurposeNow let's ask a question that applies to every dataset you touch. How good is this data? GIS professionals describe quality across five dimensions: positional accuracy, attribute accuracy, logical consistency, completeness, and currency, meaning how up to date the data are. Here's a distinction that trips up many beginners. Accuracy is closeness to truth. Precision is consistency across repeated measurements. A precise measurement can still be inaccurate, and the reverse is true. This is why we talk about fitness for use. Data that is good enough for one question may be unsuitable for another. Before analysis, check completeness, consistency, currency, and spatial coverage. Ground-truth samples and reported error make uncertainty visible. Confusion here is normal, so start small. Next, we look at coordinate systems, projections, and scale.
 1 min
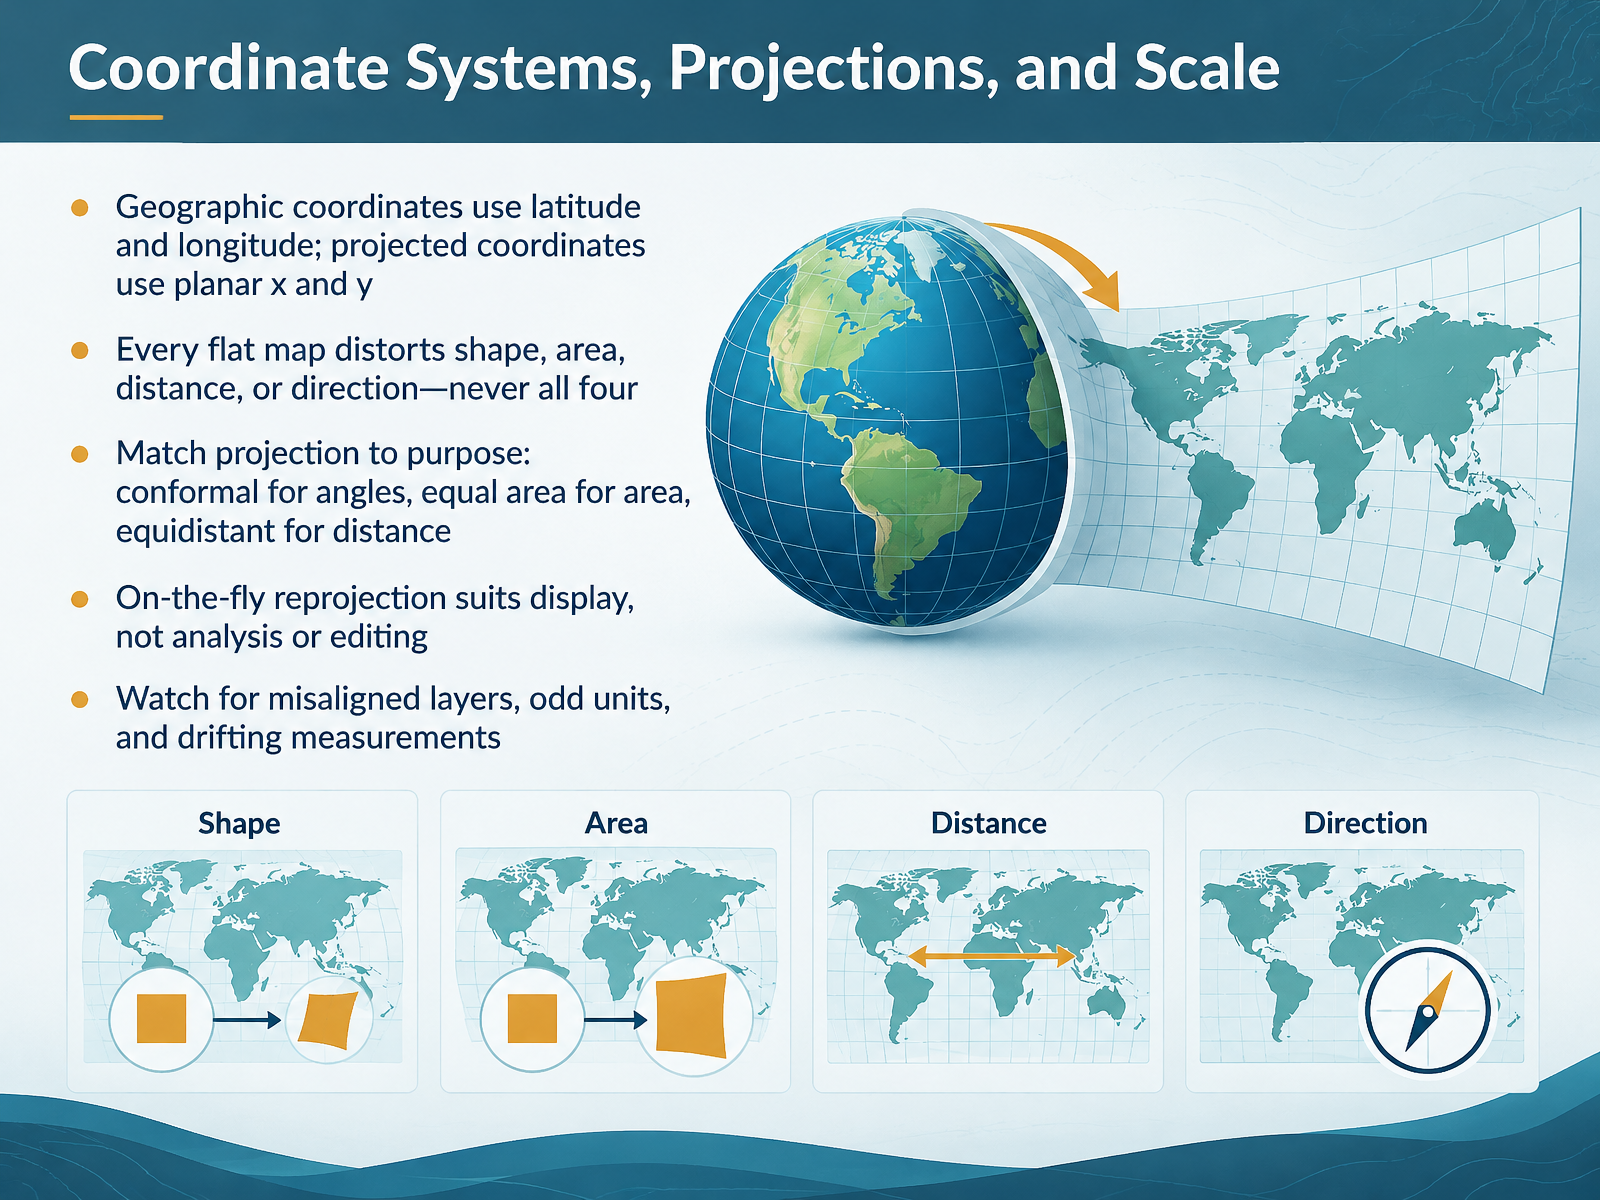
- 10Coordinate Systems, Projections, and ScaleNow let's talk about coordinate systems, projections, and scale. Geographic coordinates use latitude and longitude, angles on the curved earth. Projected coordinates use flat x and y grid numbers, like a sheet of graph paper. Here's why that matters: every flat map distorts shape, area, distance, or direction, and never all four. So match the projection to your purpose. Conformal projections keep angles correct. Equal area projections keep area correct. Equidistant projections keep distance correct along certain lines. A common beginner worry is which one to pick. That is normal, and it gets easier with practice. One more caution: on-the-fly reprojection is fine for display, but avoid it for analysis or editing. Watch for misaligned layers, odd units, and drifting measurements. Now let's move on to asking spatial questions that data can answer.
 1 min
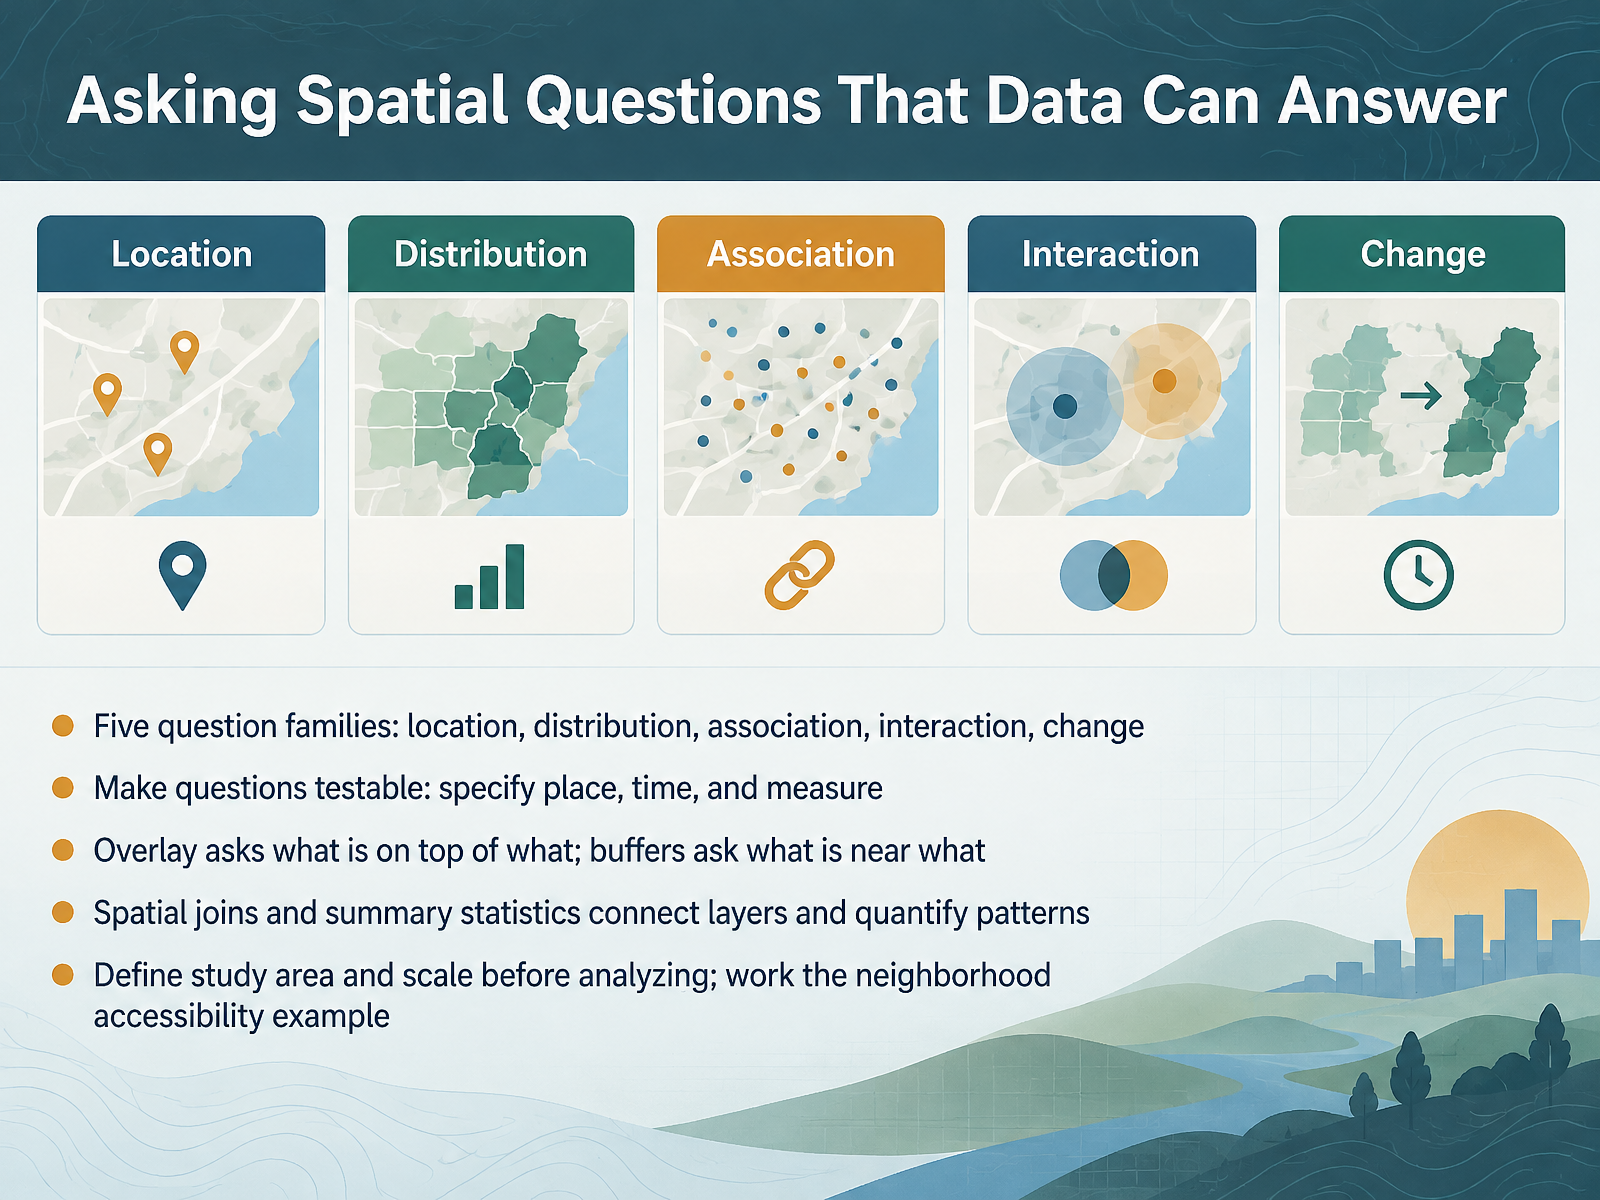
- 11Asking Spatial Questions That Data Can AnswerNow let's turn analysis into a well-formed question. GIS can help with five question families: location, asking where something is; distribution, asking whether it is clustered or spread out; association, asking what else is nearby; interaction, asking how places are linked; and change, asking how a pattern shifts over time. Here's why that matters. Vague questions produce vague maps. To make a question testable, specify the place, the time, and the measure. Then match the tool to the question. Overlay asks what is on top of what, like which neighborhoods sit inside a floodplain. Buffers ask what is near what, like which homes fall within a half mile of a grocery store. Spatial joins connect layers, and summary statistics quantify the result. Finally, define your study area and scale first, then work the neighborhood accessibility example. Next, from question to map, a simple analysis workflow.
 2 min
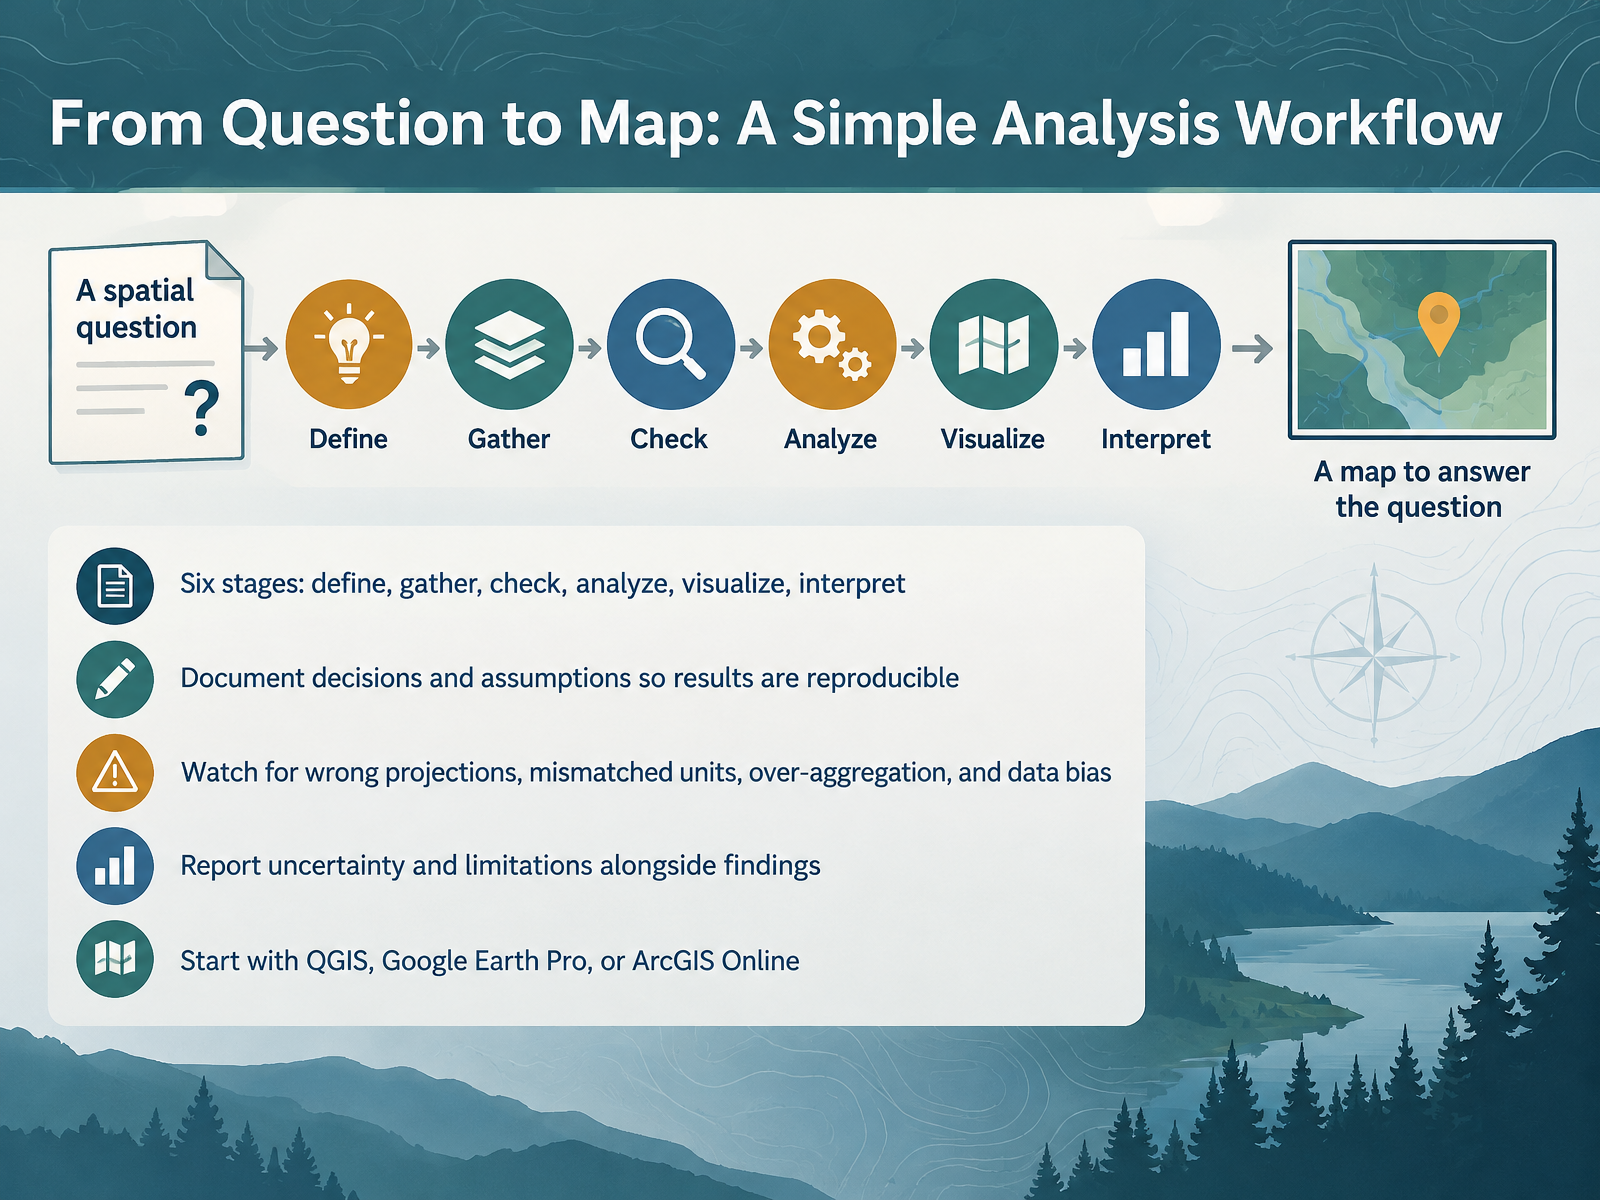
- 12From Question to Map: A Simple Analysis WorkflowSo let's pull everything together into a repeatable workflow. Every analysis moves through six stages: define, gather, check, analyze, visualize, and interpret. Start by defining your question clearly. For example, ask which neighborhoods sit within one kilometer of a park. Gather the layers you need. Then check them: confirm the projection, the coordinate system that places data on a flat map, and confirm units match. Here's why that matters. A distance measured in feet inside a layer stored in meters can quietly break your buffer. After analyzing, visualize and interpret the result. Document your decisions and assumptions so someone can reproduce your work. Watch for wrong projections, mismatched units, over-aggregation, and data bias. Report uncertainty alongside findings. Confusion about which tool to choose is normal at this stage. Begin with QGIS, Google Earth Pro, or ArcGIS Online. Next, we put this into practice with Practice Activity: Read a Map, Ask a Question.
 2 min
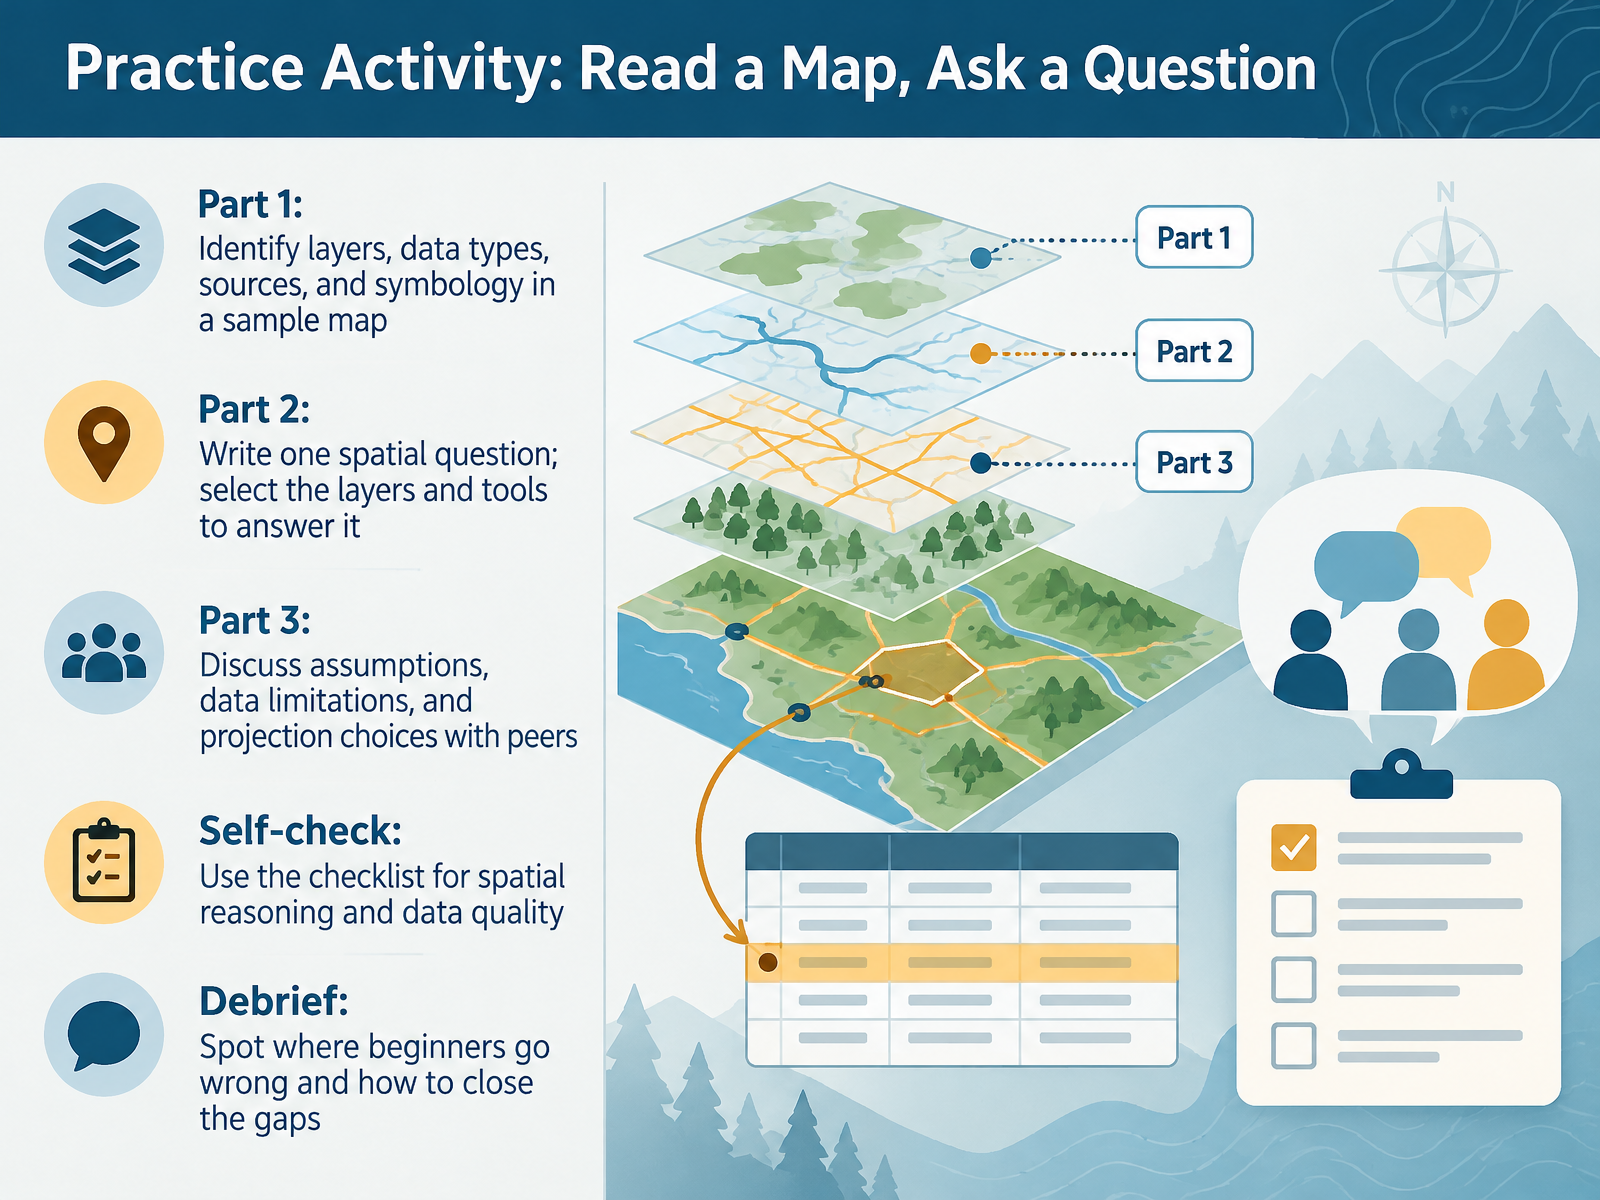
- 13Practice Activity: Read a Map, Ask a QuestionNow let's put these ideas into practice with a hands-on activity. In part one, you'll examine a sample map and identify its layers, data types, data sources, and symbology, which simply means how symbols are used to represent features. In part two, you'll write one spatial question, then choose the layers and tools you'd need to answer it. In part three, you'll discuss your assumptions, data limitations, and projection choices with peers. Here's why that matters: every dataset is an approximation, so naming those limits is part of good reasoning, not a failure. Use the self-check checklist to test your spatial reasoning and data quality. In the debrief, we'll spot where beginners commonly go wrong and how to close those gaps. If jargon feels heavy right now, that's normal. Next, we'll wrap up with Key Takeaways and Next Steps.
 doc.esri.comdoc.esri.comdoc.esri.com+21 min
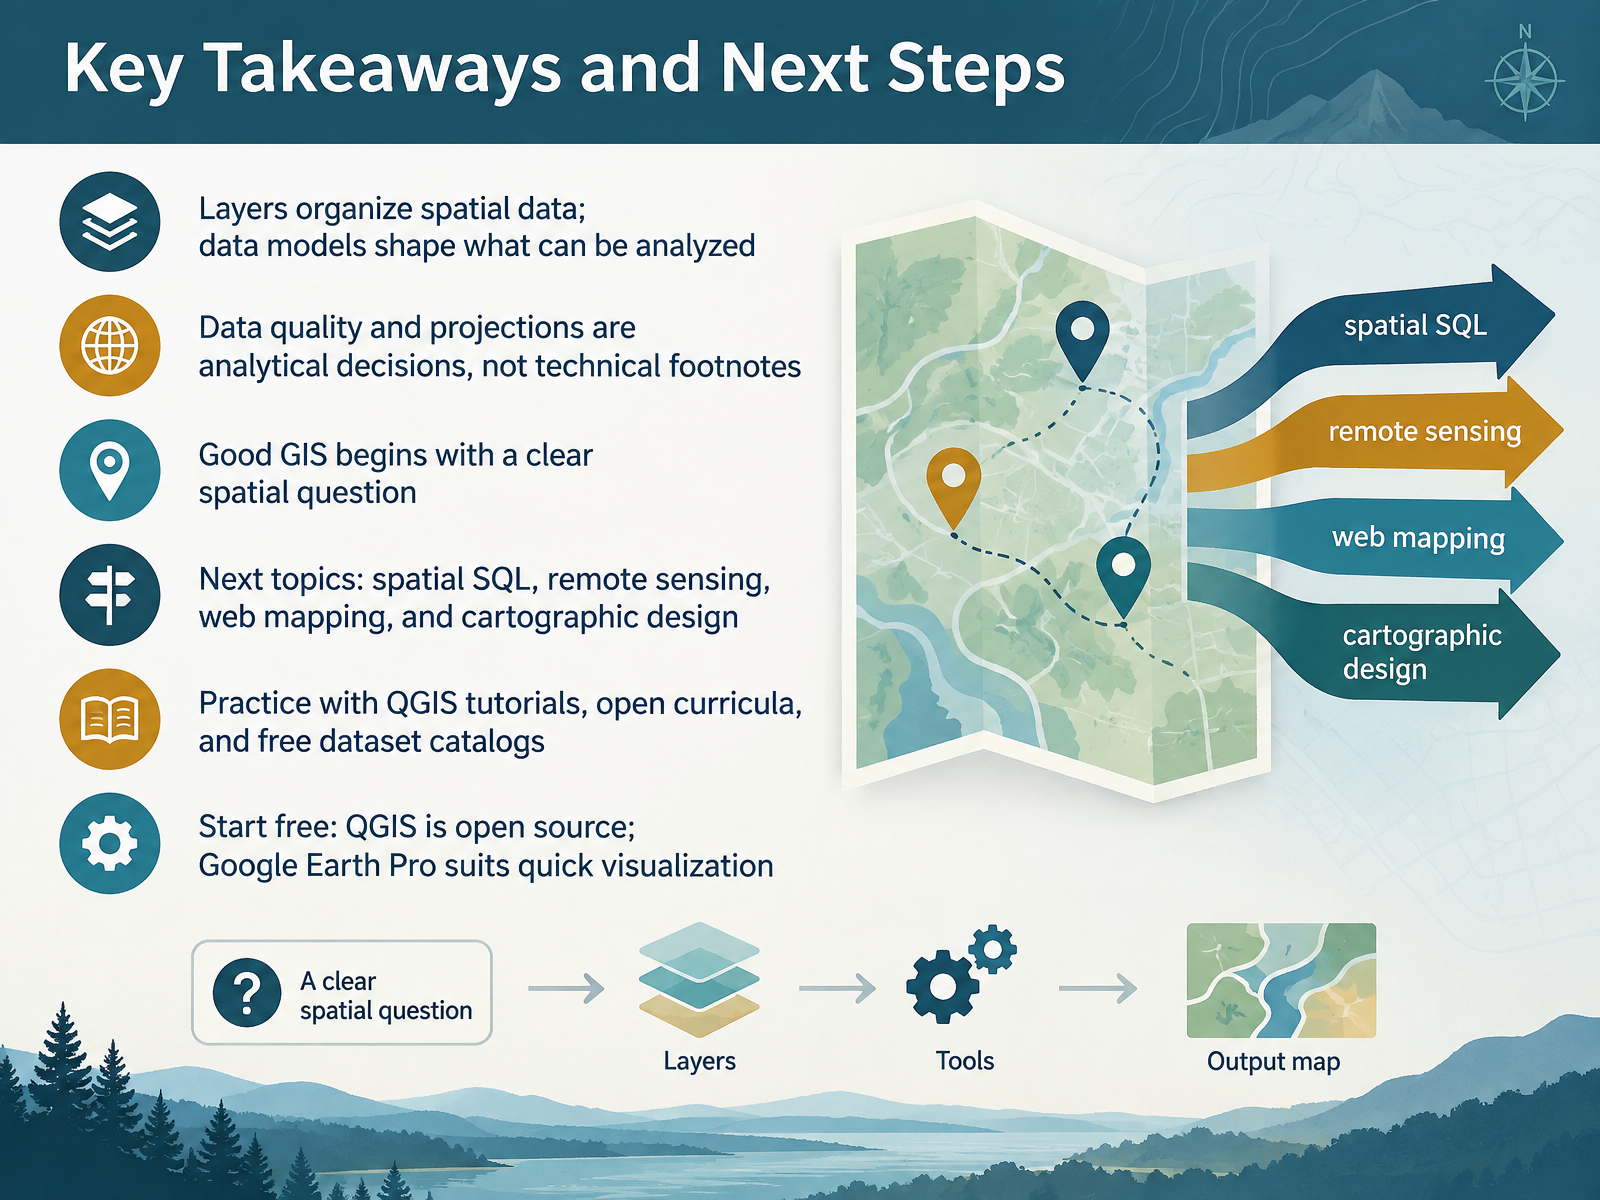
- 14Key Takeaways and Next StepsLet's bring this together. Layers organize spatial data, and your data model shapes what you can actually analyze. Data quality and projections are analytical decisions, not technical footnotes. And good GIS begins with a clear spatial question. If you have felt jargon overload or uncertainty about which layer to choose, that is completely normal at this stage. Next up, you can explore spatial SQL, remote sensing, web mapping, and cartographic design. To practice, try QGIS tutorials, open curricula, and free dataset catalogs. QGIS is free and open source, and Google Earth Pro works well for quick visualization. Thank you for learning with me today. Start small, ask one good spatial question, and keep exploring. You are ready for the next step.
 1 min
Take the deck with you
Download this course as a file — free, no sign-up needed.
- PDF handoutEvery slide page, ready to print or share.15 pages · 3.9 MBDownload
- Narrated PowerPointThe deck that presents itself — every slide carries the digital human's narration video.15 pages · 23.7 MBDownload
- PowerPoint slidesThe full deck as a .pptx — open it in PowerPoint, Keynote, or Google Slides.15 pages · 3.8 MBDownload
Free to use in your own training — please keep the PersonWise credit page at the end.
Have your own deck? Turn it into a course
Sources consulted
Web sources consulted while building this course.
- Geographic information system — en.wikipedia.org
- What is a geographic information system (GIS)? | U.S. Geological Survey — usgs.gov
- WHAT IS GIS? Geographic Information System (GIS) — esri.com
- GIS Definition | GIS Dictionary — support.esri.com
- Geospatial Concepts - Geospatial Concepts - Guides at Johns Hopkins University — guides.library.jhu.edu
- Graphicacy and spatial thinking (menu) - Geographical Association — geography.org.uk
- Spatial Thinking, Cognition, and Learning — doi.org
- Spatial Thinking Concepts in Geography Standards in the United ... — digital.library.txst.edu
- TOTHINK — sfu.ca
- National Geographic Learning / Cengage — ngl.cengage.com
- Layers | ArcGIS Pro documentation — doc.esri.com
- Symbolize map layers | ArcGIS Pro documentation — doc.esri.com
- Symbolize feature layers | ArcGIS Pro documentation — doc.esri.com
- Data layers | Documentation | Esri Developer — developers.arcgis.com
- Feature layers—ArcGIS Online Help | Documentation — doc.arcgis.com
- 1.6: Data Model - Geosciences LibreTexts — geo.libretexts.org
- Vectors and Rasters | QGIS Tutorial — guides.geospatial.bas.ac.uk
- 5 Data Types - Vector vs. Raster vs. other types of spatial data | Intro to Desktop GIS with QGIS — ucdavisdatalab.github.io
- Spatial Data — PyGIS™ - Python Open Source Spatial Programming & Remote Sensing — pygis.io
- Chapter 2 Feature Representation | Intro to GIS and Spatial Analysis — mgimond.github.io