Begin
14 pages · ~28 min
Map Scale, Legends, and Symbols
This training teaches learners to read and interpret map scales, legends, and symbols accurately, building essential map literacy skills for navigation and geographic analysis.
A digital instructor presents all 14 pages. Hold “Ask” at any point and ask out loud — the answer comes from this course. No sign-up needed.
What you’ll learn
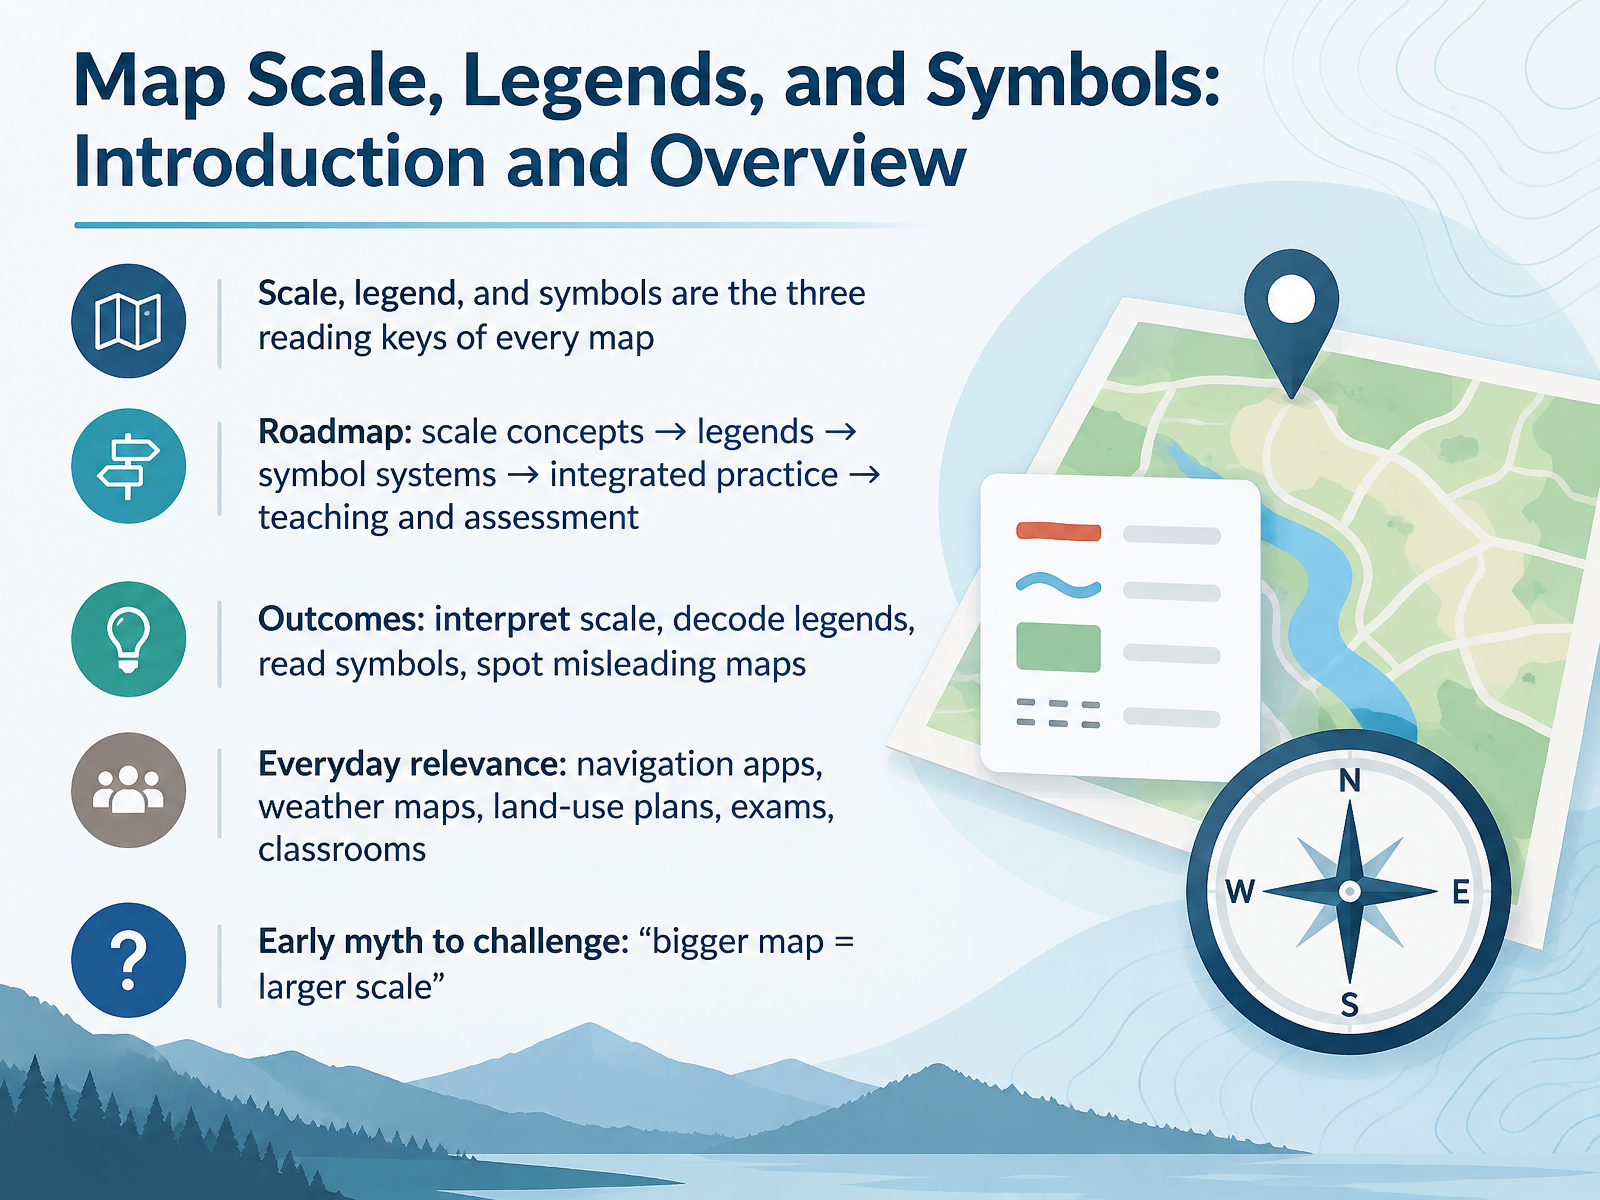
- 01Map Scale, Legends, and Symbols: Introduction and OverviewWelcome. Today we start a short course on the three reading keys of every map: scale, legends, and symbols. Here is our plan. First, we look at scale concepts. Then legends, then symbol systems. After that, we practice reading real maps together, and we finish with teaching and assessment ideas. By the end, you should be able to interpret scale, decode a legend, read symbols with confidence, and spot misleading maps. These skills matter in daily life. Think of navigation apps, weather maps, land-use plans, exams, and your own classroom. One early myth to challenge: a bigger map does not mean a larger scale. Keep that in mind as we go. Let's begin with what map scale really means.education.nationalgeographic.orgesri.comdoi.org+21 min
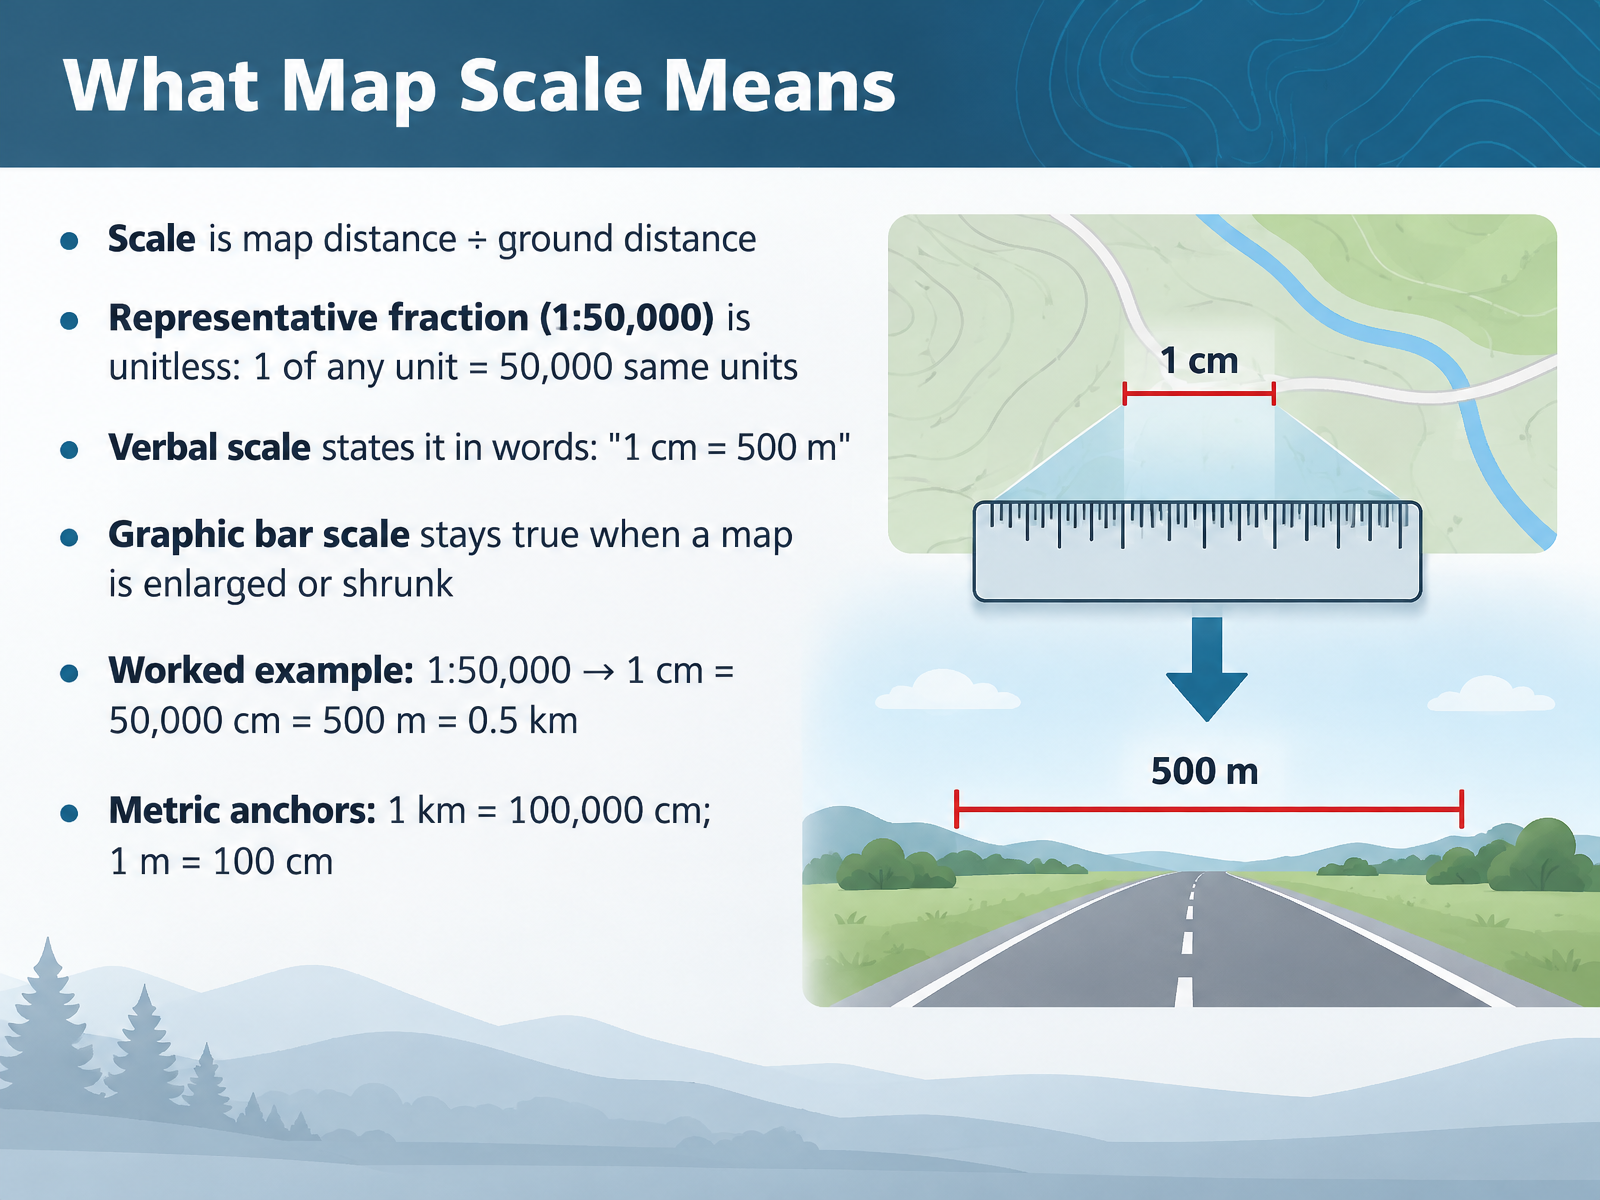
- 02What Map Scale MeansLet's look at what map scale actually means. Scale is map distance divided by ground distance. It tells you how much the real world has been shrunk to fit on the page. There are three common ways to express it. First, the representative fraction, like one to fifty thousand. It is unitless. One of any unit on the map equals fifty thousand of the same units on the ground. Second, a verbal scale states it in words, for example, one centimeter equals five hundred meters. Third, a graphic bar scale stays true even when a map is enlarged or shrunk. Here is a worked example. With one to fifty thousand, one centimeter on the map equals fifty thousand centimeters on the ground, which is five hundred meters, or zero point five kilometers. Keep two metric anchors in mind. One kilometer equals one hundred thousand centimeters, and one meter equals one hundred centimeters. Next, we'll practice converting between these scale formats.
 education.nationalgeographic.orgesri.comdoi.org+21 min
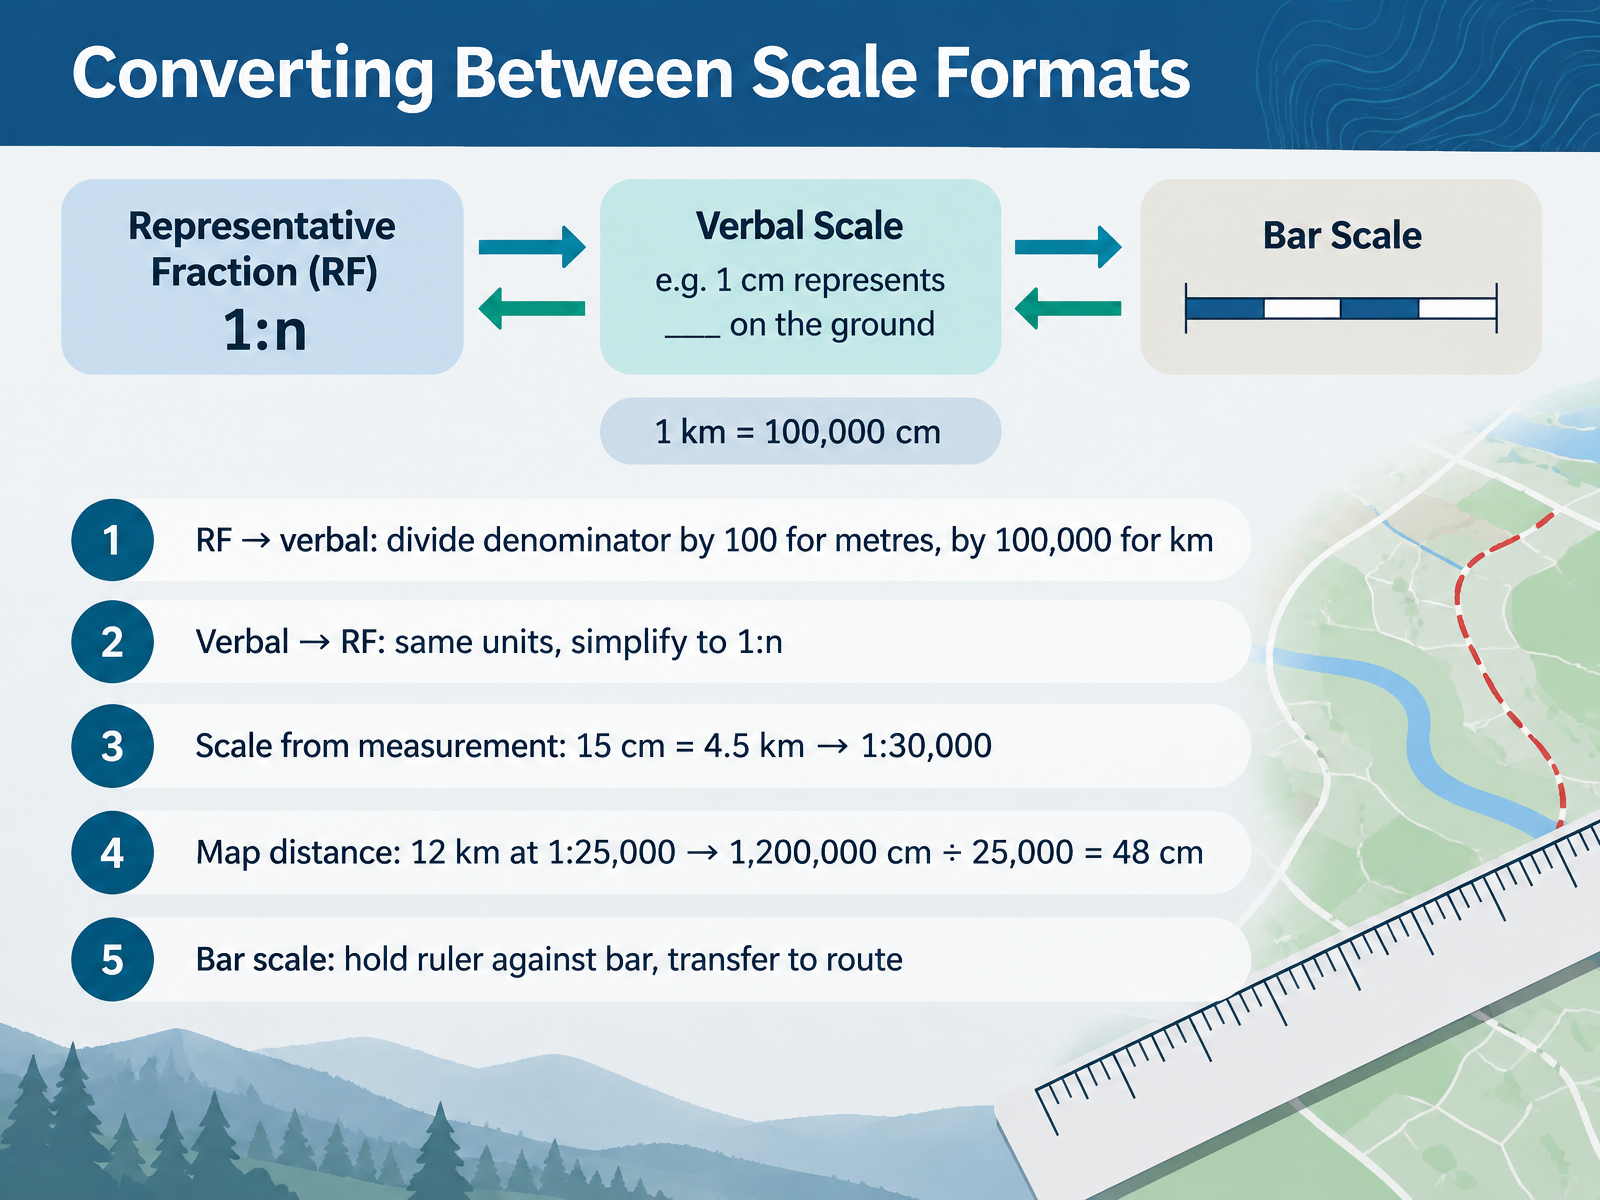
- 03Converting Between Scale FormatsNow let's look at how to move between scale formats. To turn a representative fraction into words, divide the denominator by one hundred for metres, or by one hundred thousand for kilometres. To go the other way, put both distances in the same units, then simplify to one to n. If a measured fifteen centimetres on the map equals four point five kilometres on the ground, convert to centimetres and you get a scale of one to thirty thousand. To find map distance, take twelve kilometres at one to twenty five thousand. That's one million two hundred thousand centimetres, divided by twenty five thousand, which gives forty eight centimetres on the map. For a bar scale, hold a ruler against the bar, then transfer that length to your route. Next, large scale versus small scale, reading the difference.
 education.nationalgeographic.orgesri.comdoi.org+21 min
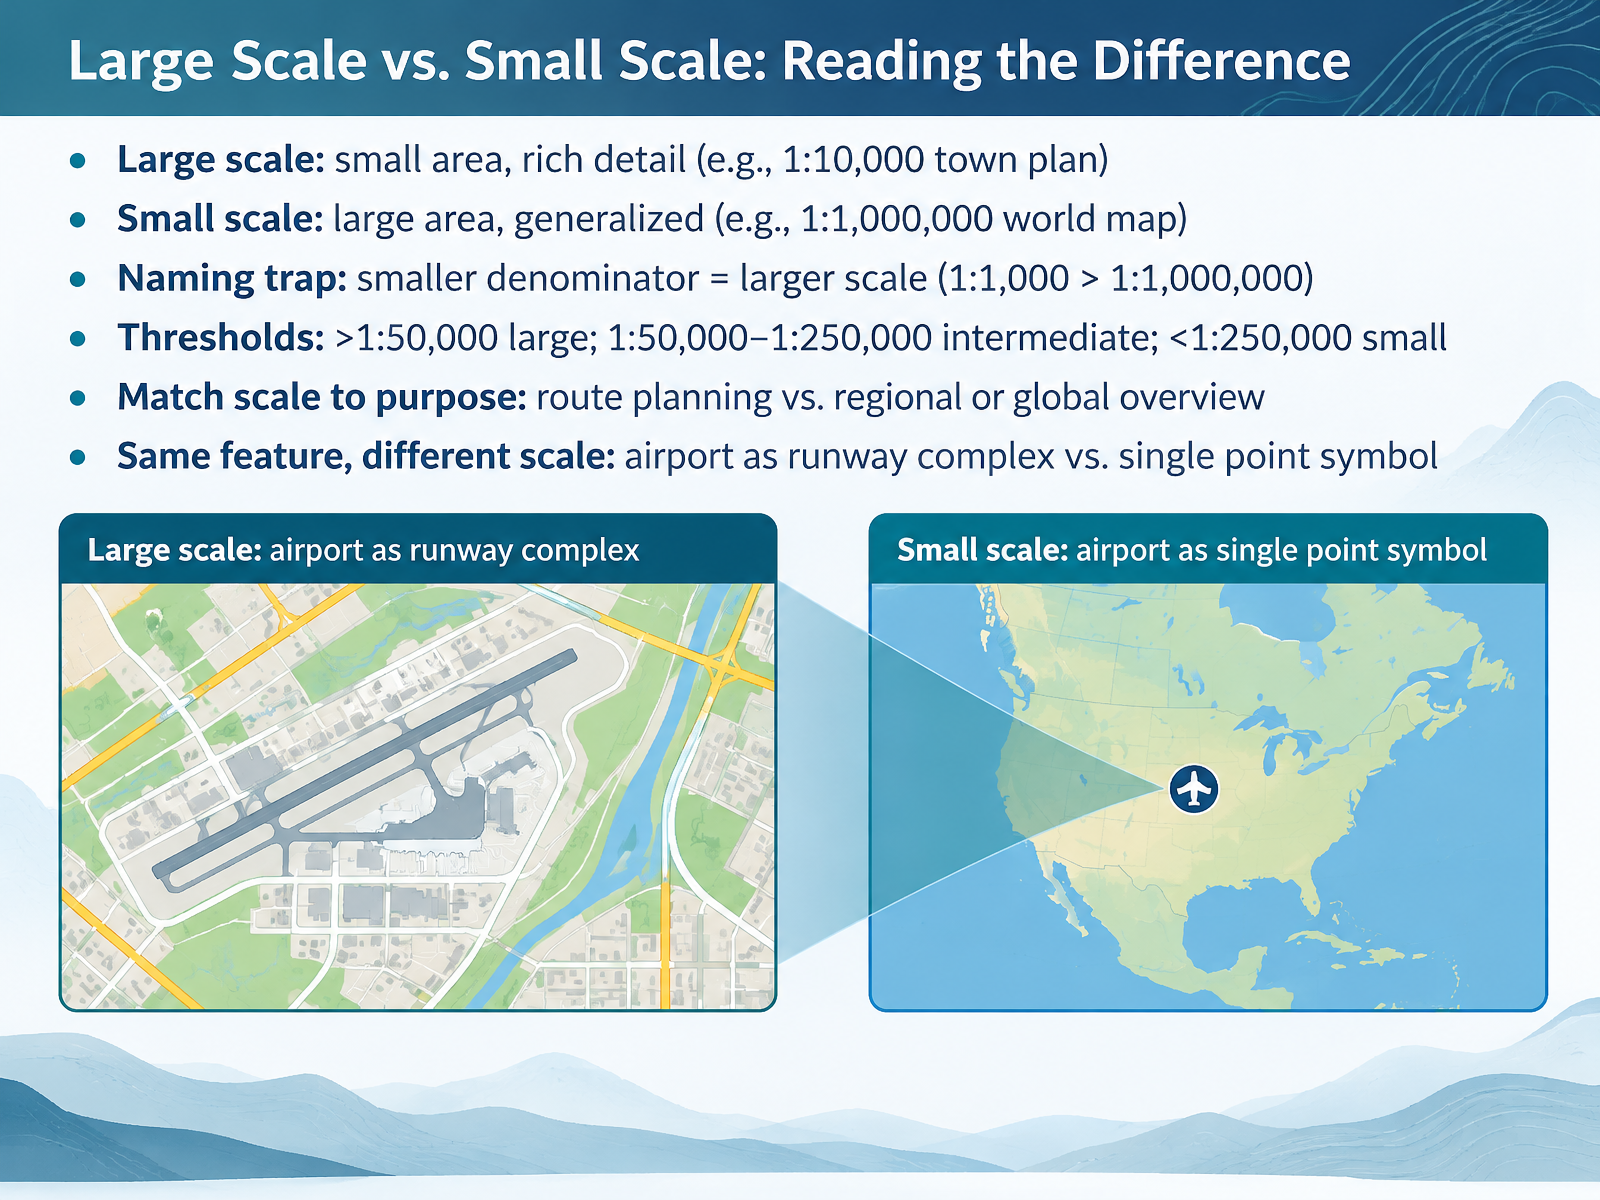
- 04Large Scale vs. Small Scale: Reading the DifferenceNow let's compare large scale and small scale maps. A large scale map shows a small area with rich detail. A town plan at one to ten thousand is a good example. A small scale map shows a large area with less detail. A world map at one to one million is the classic case. Here is the naming trap. The numbers work in reverse. A smaller denominator means a larger scale. One to one thousand is larger than one to one million. For thresholds, maps larger than one to fifty thousand are large scale. One to fifty thousand up to one to two hundred fifty thousand is intermediate. Anything smaller than that is small scale. Match the scale to your purpose, a route plan or a regional overview. And the same airport can be a runway complex on one map and a single point symbol on another. Next, we'll work with scale for distance, area, and measurement.
 education.nationalgeographic.orgdocs.os.ukpubs.usgs.gov+22 min
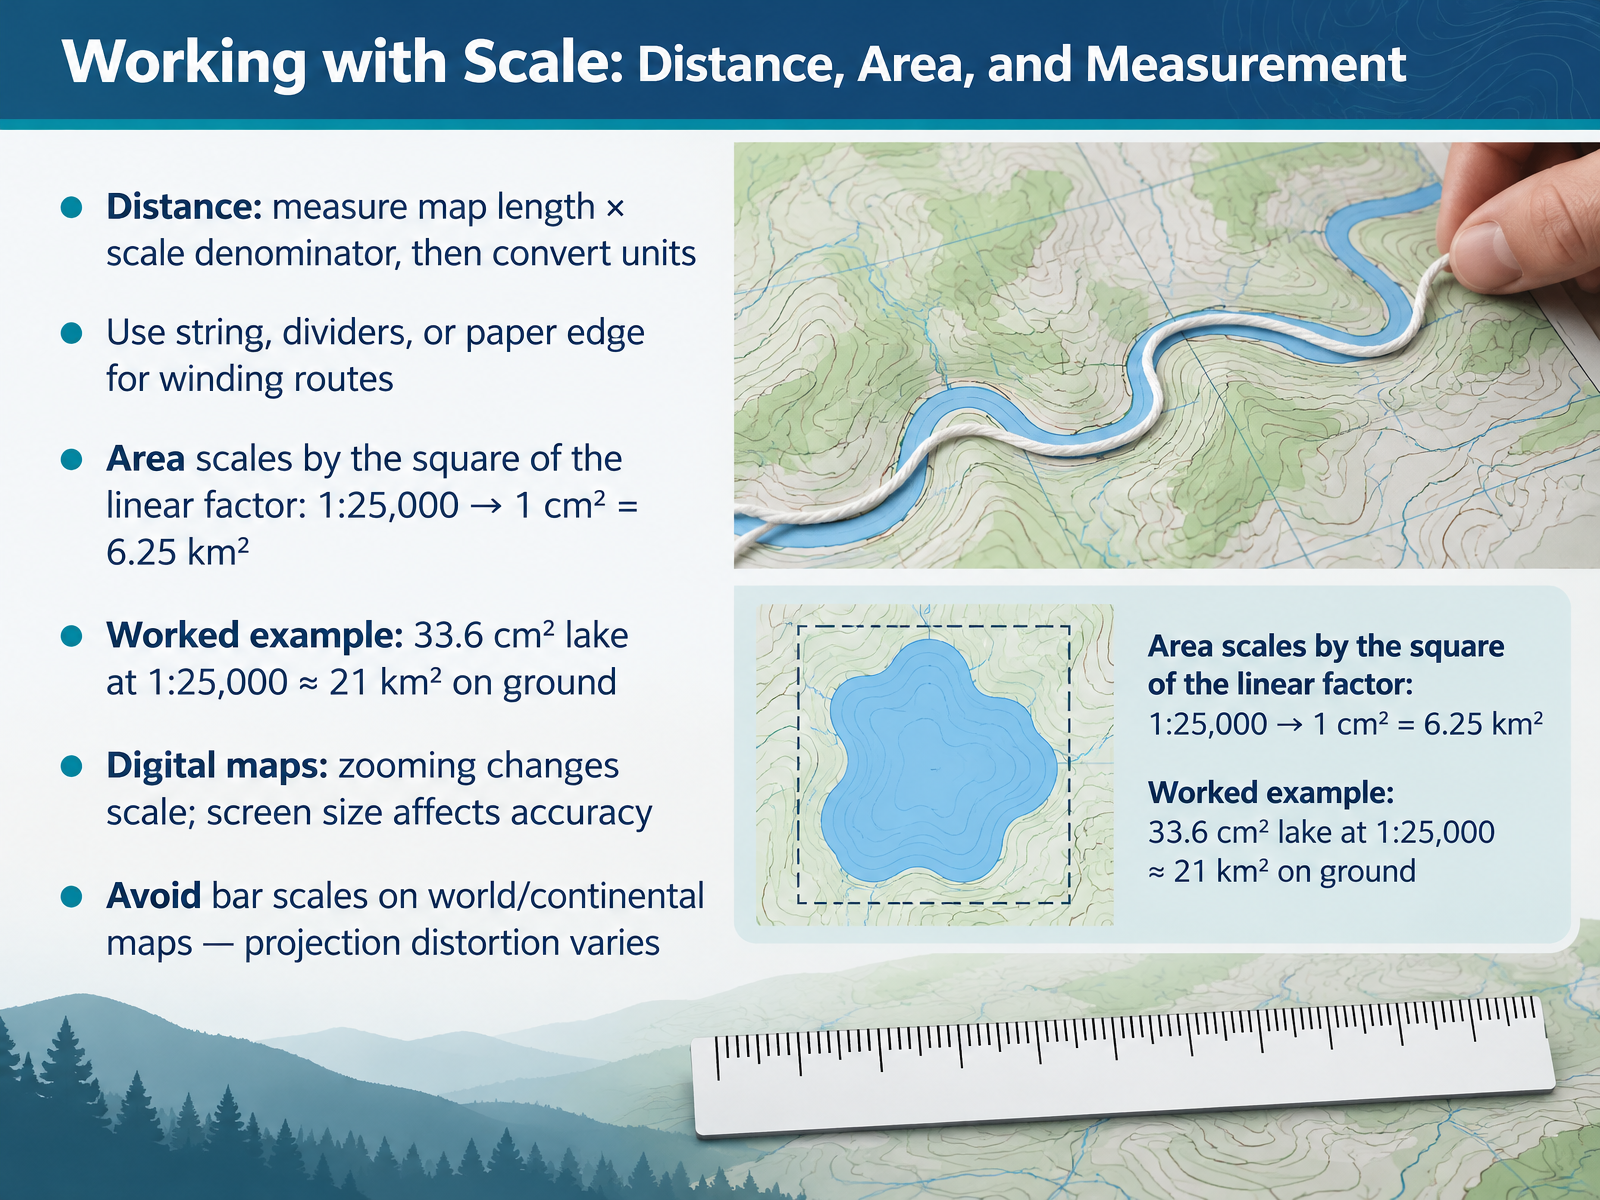
- 05Working with Scale: Distance, Area, and MeasurementNow let's put scale to work. For distance, measure the length on the map, multiply by the scale denominator, then convert the units. If a point is two centimetres away on a one to fifty thousand map, that is one hundred thousand centimetres, or one kilometre on the ground. For winding routes, use string, dividers, or the edge of a paper strip. Area scales by the square of the linear factor. On a one to twenty five thousand map, one square centimetre equals six point two five square kilometres. So a lake measuring thirty three point six square centimetres is approximately twenty one square kilometres on the ground. Digital maps change scale as you zoom, and screen size affects accuracy, so always check the current scale bar. And avoid bar scales on world or continental maps, because projection distortion varies across the map. When scale is missing or misleading, your measurements can go wrong fast.
 fundootutor.comhackmath.nettransum.org+21 min
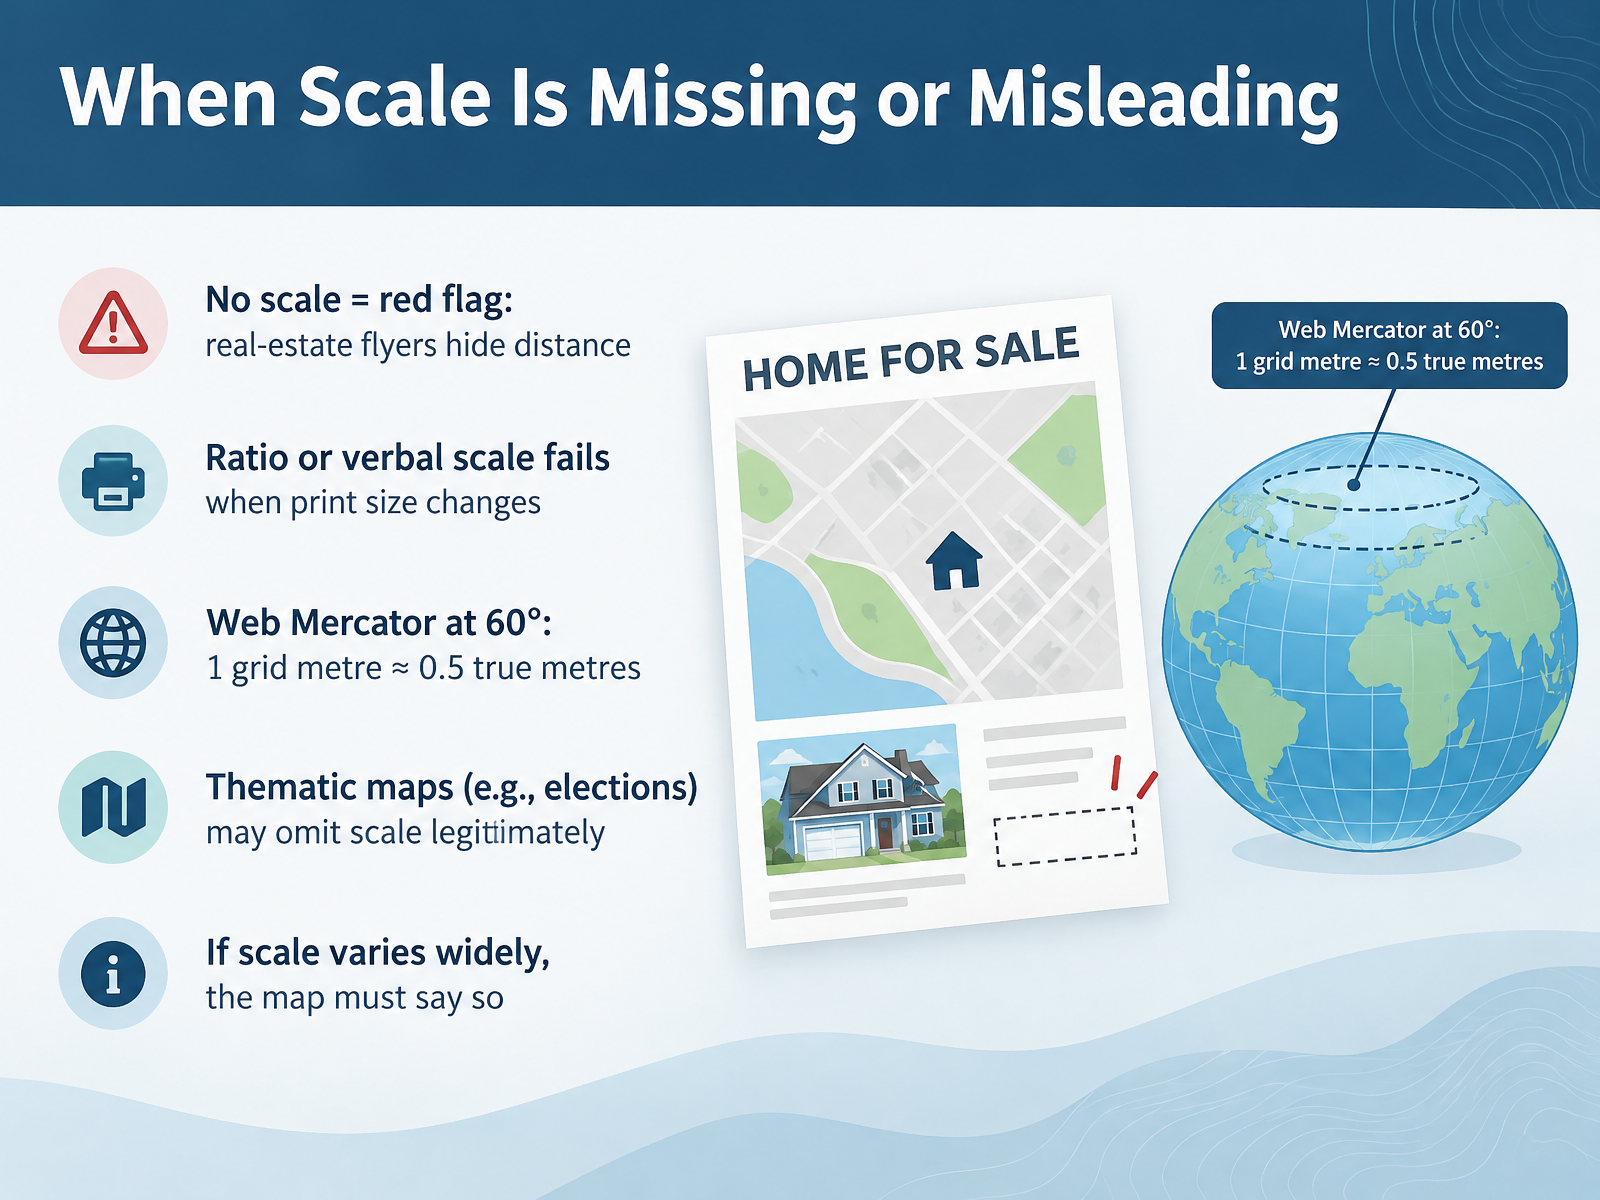
- 06When Scale Is Missing or MisleadingNow let us look at what happens when scale is missing, or when it misleads you. A map with no scale at all is a red flag. Real estate flyers often leave scale out on purpose, so a property never looks far from the shops or the highway. Ratio scales and verbal scales have their own weakness. They only hold true if the print size is controlled. Enlarge or shrink the map on a photocopier, and the numbers no longer match the ground. Projections cause trouble too. On a Web Mercator map at sixty degrees latitude, one grid metre represents roughly half a true metre. So a single scale bar on a map of Europe can be wrong by more than fifty percent from top to bottom. There is one fair exception. Thematic maps, such as election maps, may legitimately omit scale, because distance is not their message. So use this rule. If scale varies widely across a map, the map must say so, for example by naming the latitude where the scale holds. Now let us move on to the key that decodes those symbols: The Map Legend: Your Decoder Ring.
 doi.orgrepub.eur.nljmgis3015.blogspot.com+22 min
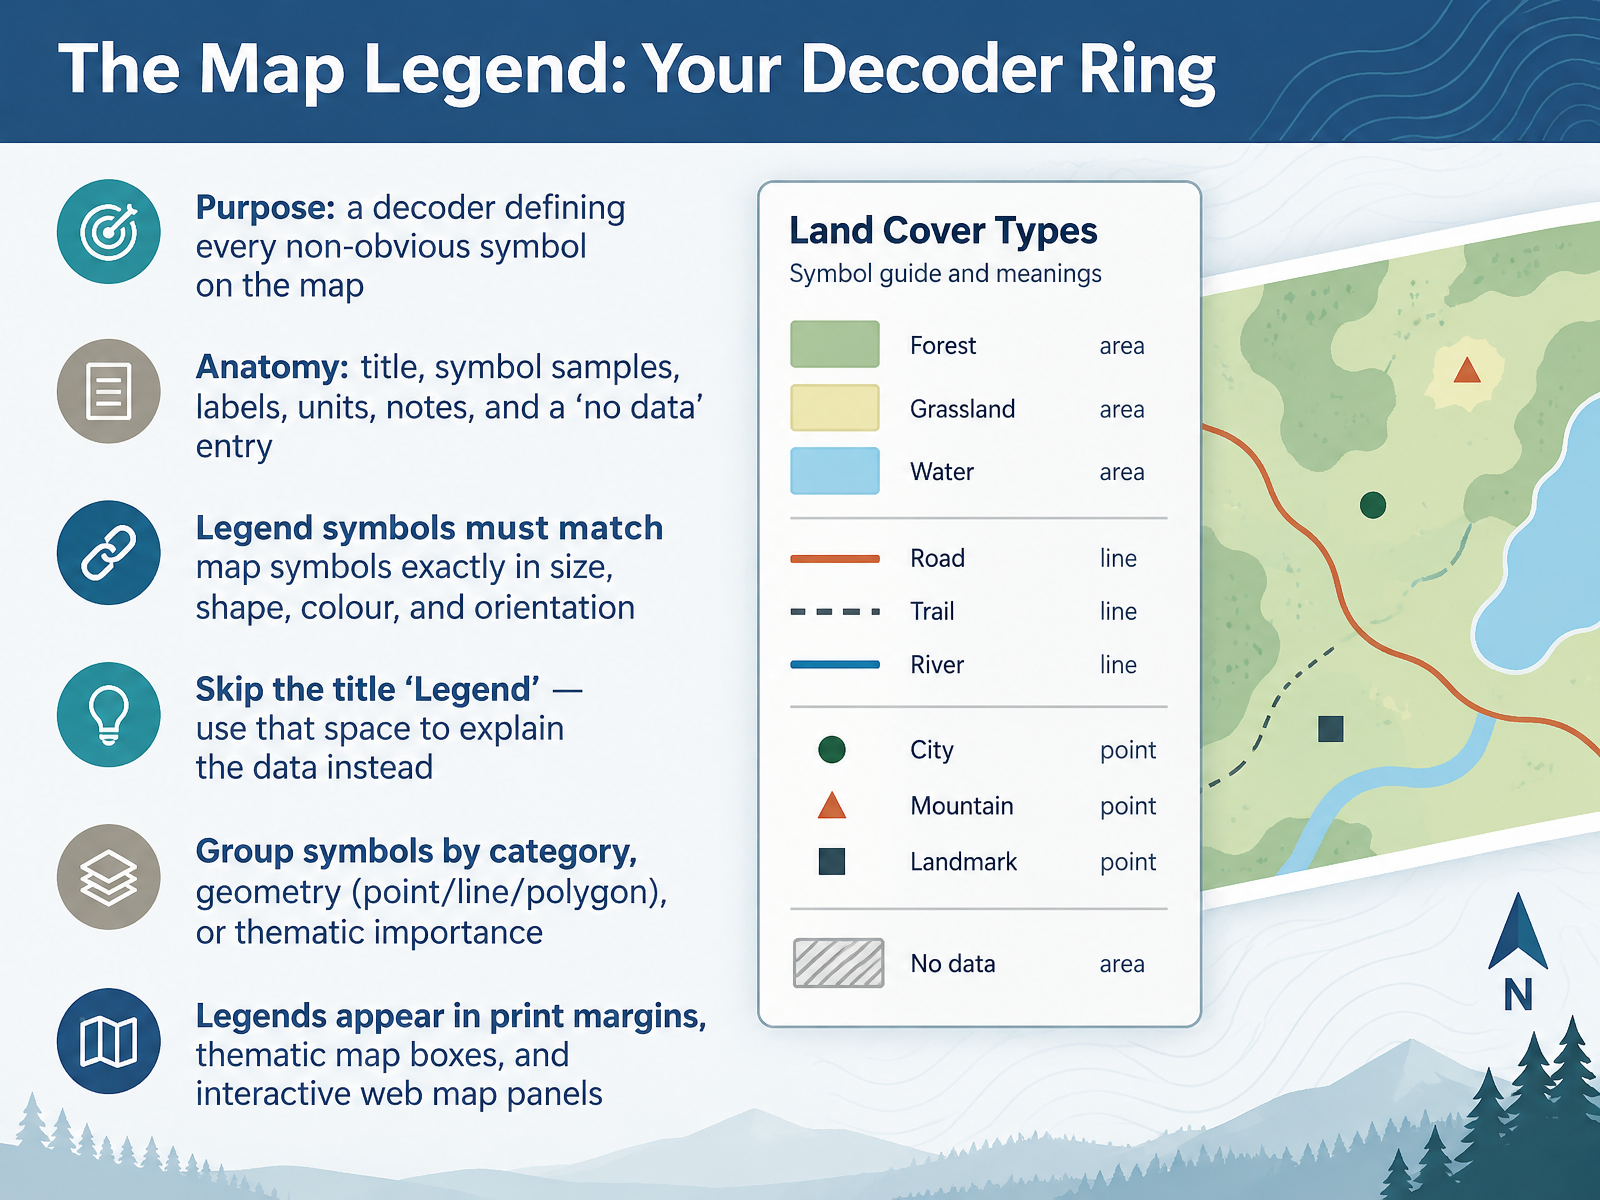
- 07The Map Legend: Your Decoder RingNow let's look at the map legend, your decoder ring. Its purpose is simple. It defines every symbol that isn't obvious, so you can read the map correctly. A complete legend usually contains a title, sample symbols, labels, units, notes, and even a no data entry. There's one rule you should never break. Legend symbols must match the map symbols exactly in size, shape, colour, and orientation. If they don't match, readers get confused. Also, don't waste space with the title Legend. Use that space to explain the data instead. Group your symbols by category, by geometry such as point, line, or polygon, or by thematic importance. You'll find legends in print margins, in boxes on thematic maps, and in panels on interactive web maps. Next, we'll explore designing legends that communicate.
 docs.os.ukesri.comdoi.org+11 min
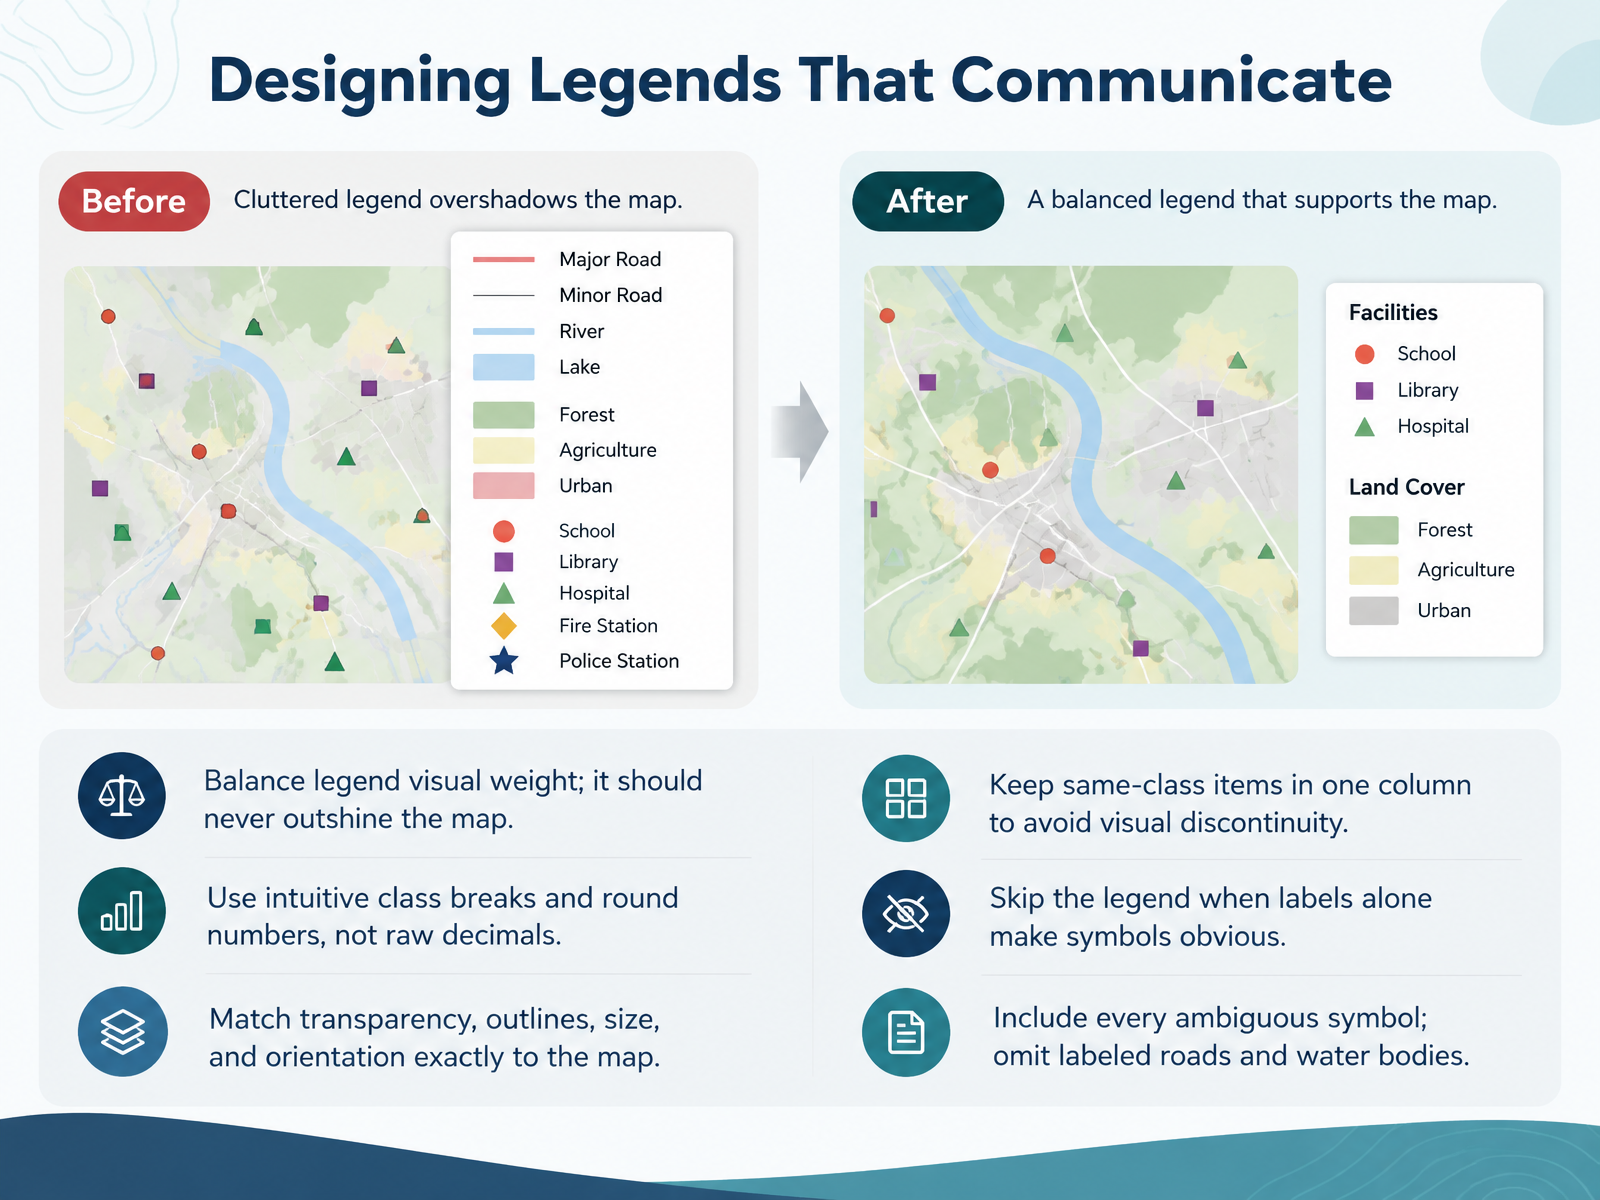
- 08Designing Legends That CommunicateNow let's talk about designing legends that actually communicate. First, balance the visual weight. Your legend should never outshine the map itself. Second, use intuitive class breaks and round numbers, not raw decimals. Third, match transparency, outlines, size, and orientation exactly to the map, so a symbol in the legend looks just like the one on the map. Fourth, keep items of the same class in one column. Splitting them apart creates visual discontinuity. Fifth, skip the legend when labels alone make symbols obvious. Sixth, include every ambiguous symbol, but you can omit roads and water bodies that are already labeled. Get these details right, and your legend becomes a quiet, reliable guide. Next, we turn to symbols and symbol systems.
 docs.os.ukesri.comdoi.org+21 min
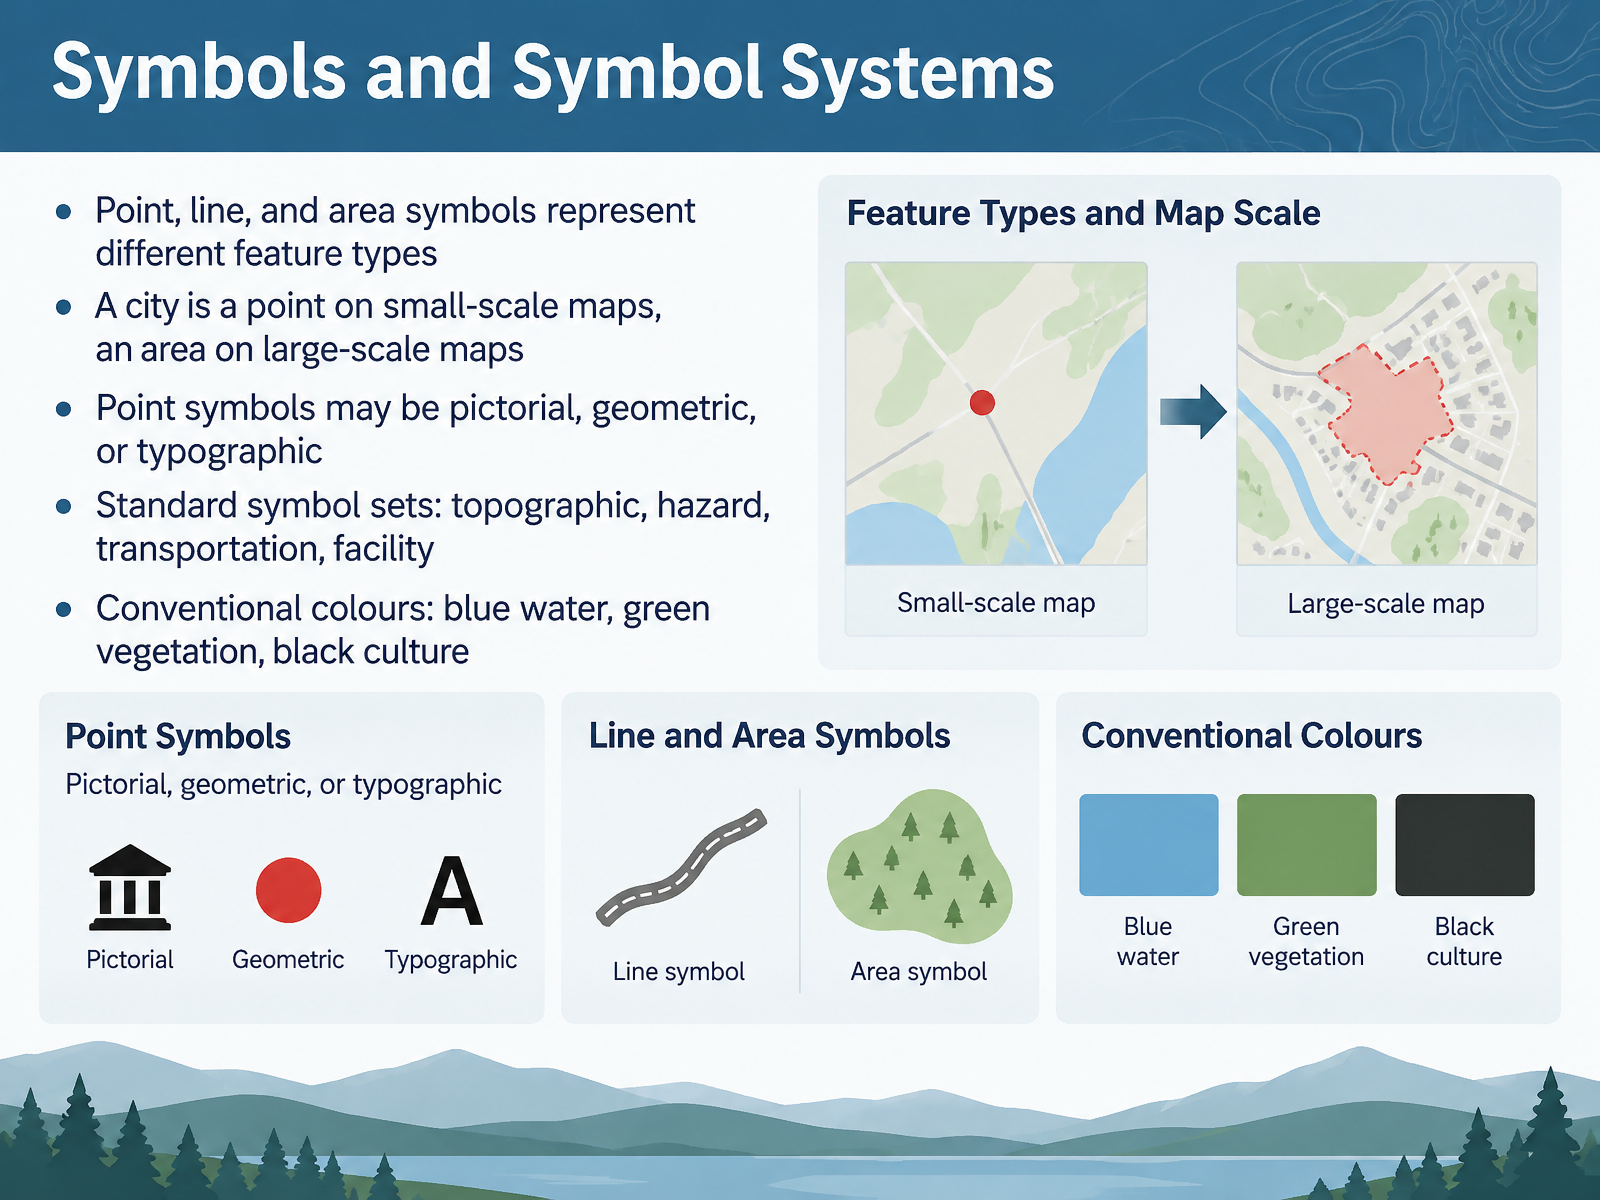
- 09Symbols and Symbol SystemsNow let's look at symbols and symbol systems. Map symbols generally come in three kinds: points, lines, and areas. Each one matches a different type of real-world feature. A point marks a single location. A line follows something long and continuous, like a road or a river. An area covers a surface, like a park or a lake. Here is a useful example. A city may appear as a single point on a small-scale map, but as a full area with streets and buildings on a large-scale map. Point symbols themselves can be pictorial, geometric, or typographic. Pictorial symbols look like the feature, such as an airplane for an airport. Geometric symbols use simple shapes like circles and squares. Typographic symbols use letters or numbers. Many maps also rely on standard symbol sets, such as topographic, hazard, transportation, and facility symbols. And you will often see conventional colours: blue for water, green for vegetation, and black for cultural features. So when you open a map, check the legend first, and let it confirm what each symbol and colour means. Next, we will explore visual variables, and how symbols encode meaning.
 2 min
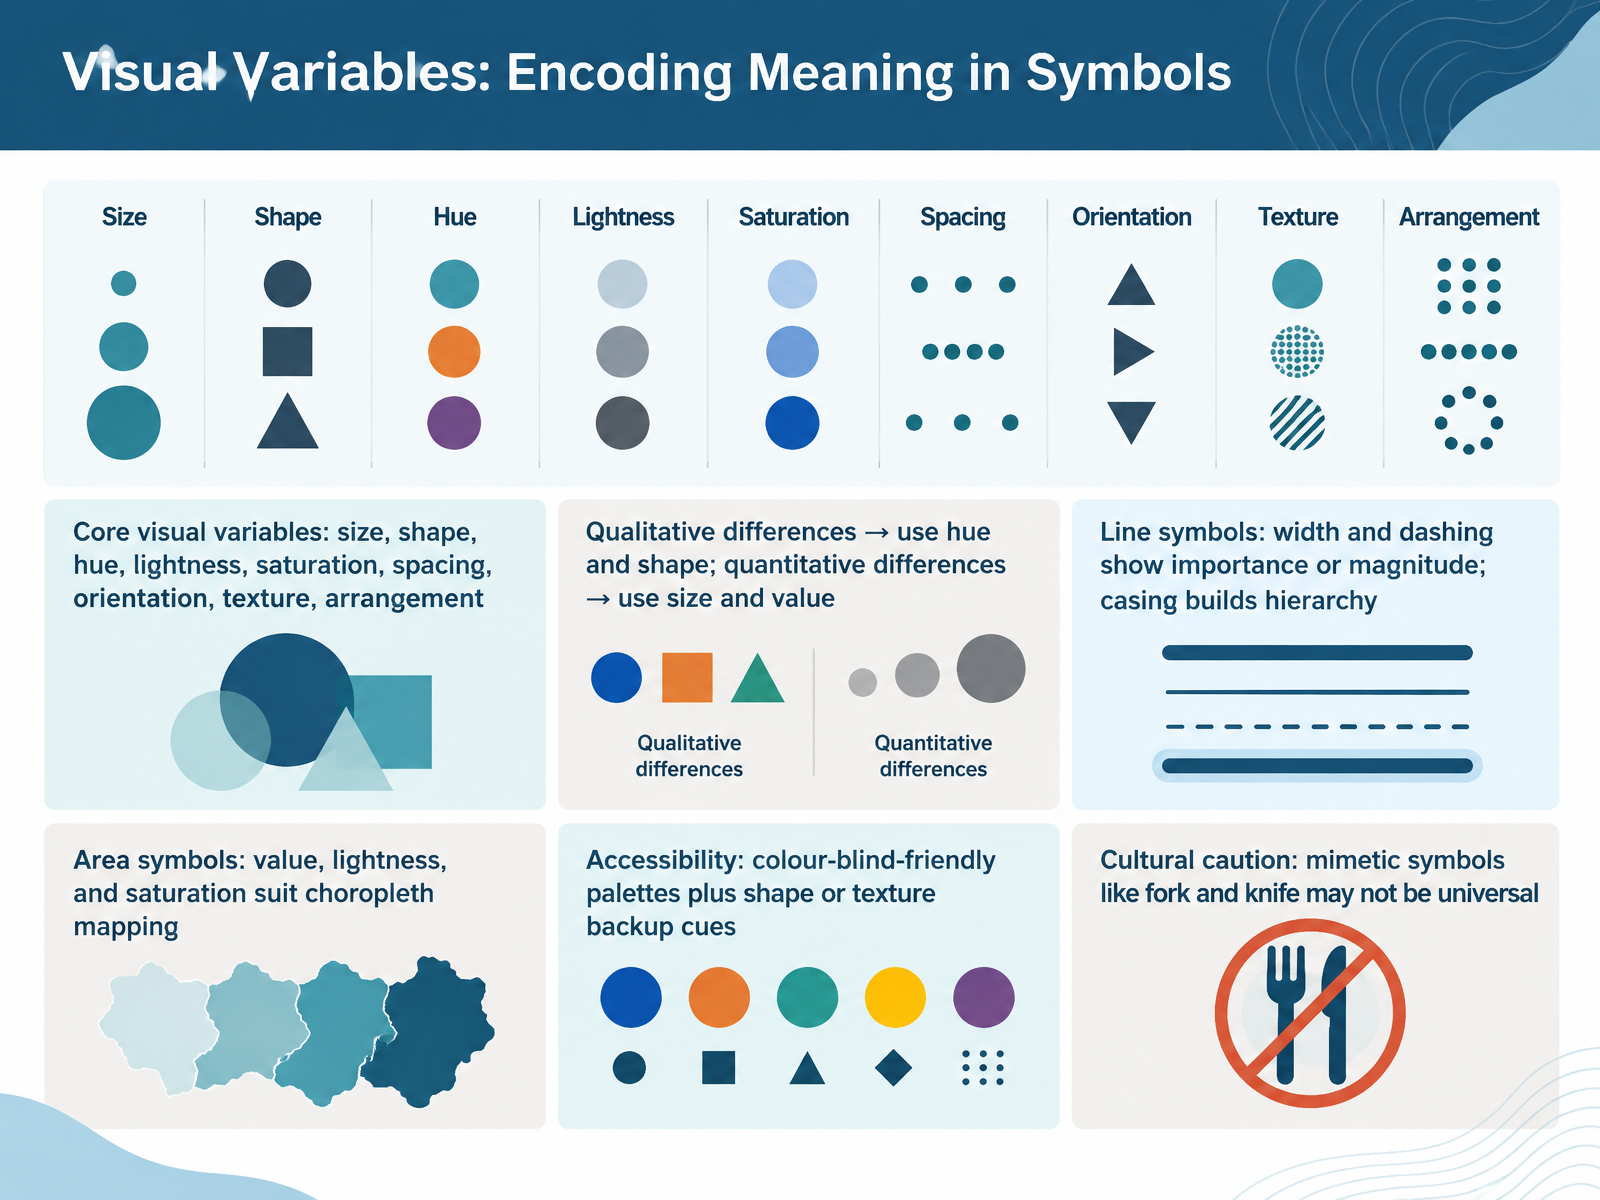
- 10Visual Variables: Encoding Meaning in SymbolsNow let's talk about visual variables, the tools that let you encode meaning in symbols. There are many of them, including size, shape, hue, lightness, saturation, spacing, orientation, texture, and arrangement. The key rule is simple. For qualitative differences, differences in kind, use hue and shape. For quantitative differences, differences in amount, use size and value. Now look at line symbols. Width and dashing show importance or magnitude. Wider lines mean more. Dashed lines mean less. And a casing, a wider line placed underneath, builds visual hierarchy. For area symbols, value, lightness, and saturation suit choropleth mapping, where you shade regions by data value. Two cautions. First, accessibility. Use colour-blind-friendly palettes, and add shape or texture as a backup cue. Second, culture. Mimetic symbols like a fork and knife may not be universal. So always check that your symbols travel well. Next, we'll bring these ideas together in Integrated Map Reading Practice.
 2 min
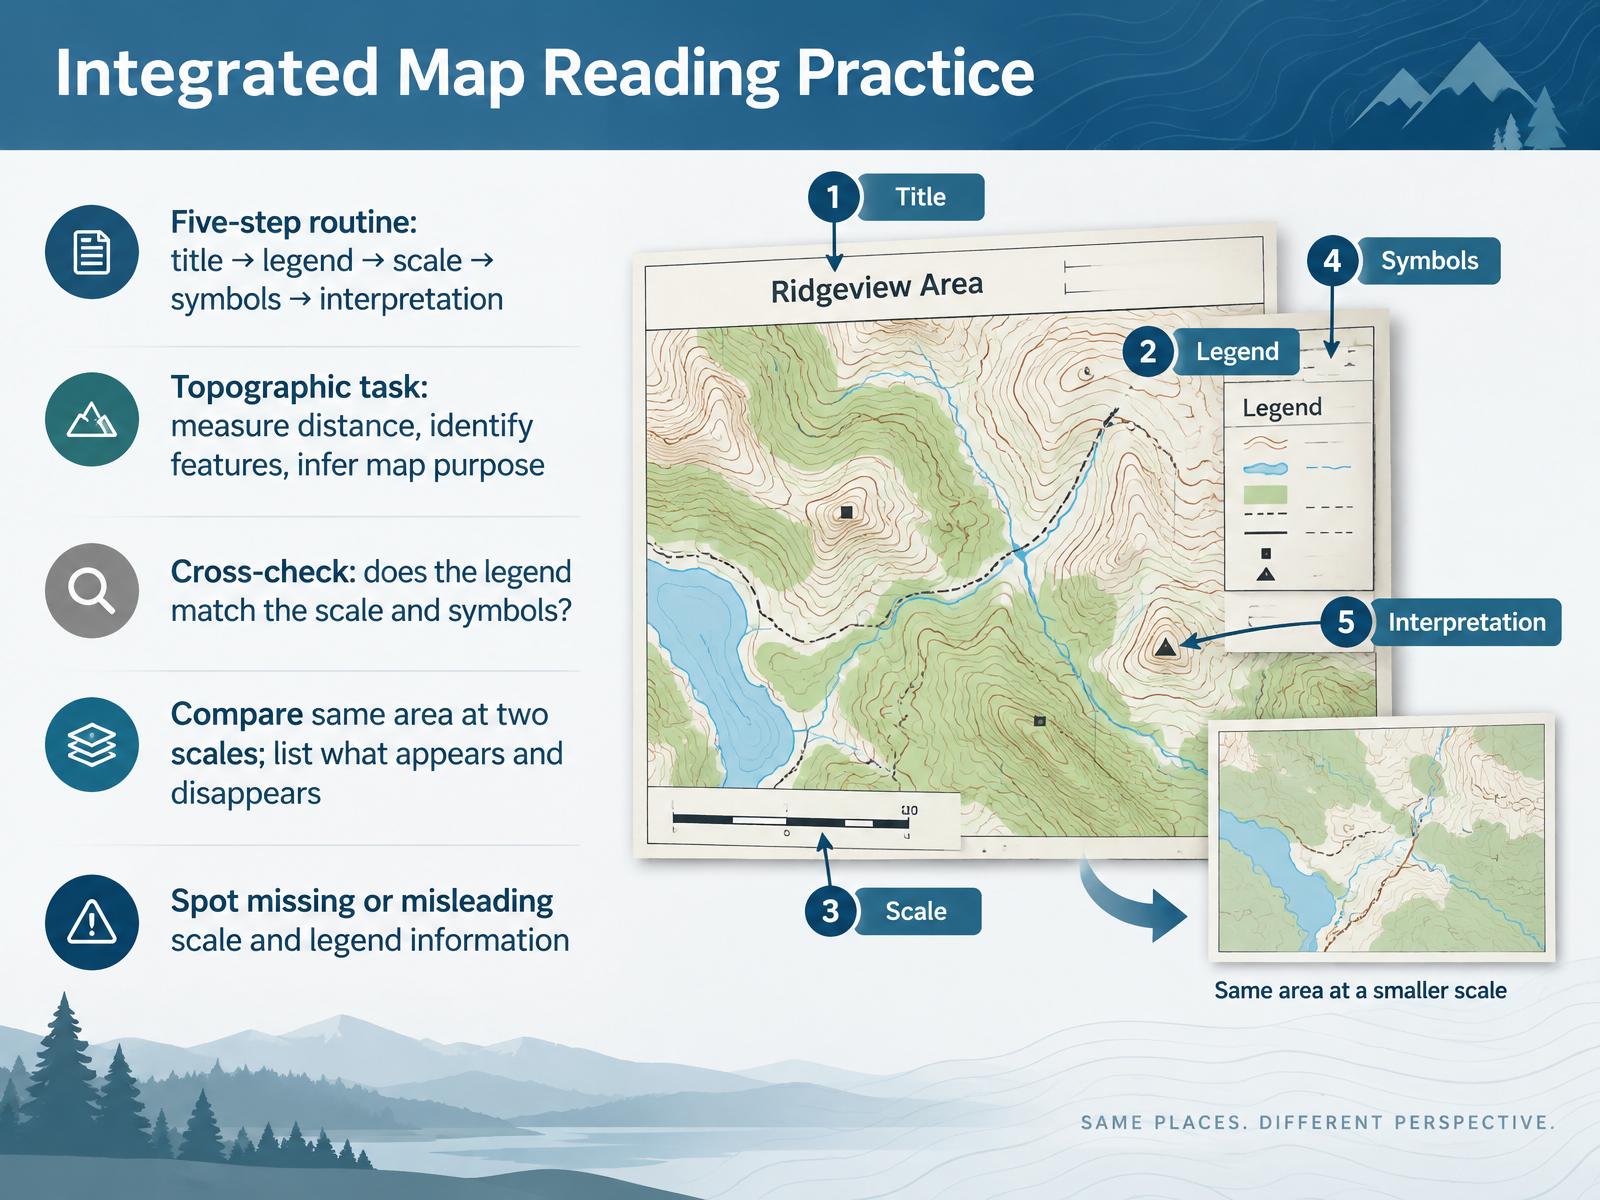
- 11Integrated Map Reading PracticeNow let's put everything together with integrated map reading practice. Use a simple five-step routine. First, read the title. Then check the legend. Next, find the scale. After that, examine the symbols. Finally, interpret what it all means. Try this on a topographic map. Measure a distance, identify a few features, and infer the map's purpose. Then cross-check. Does the legend match the scale and the symbols you see? Compare the same area at two scales. List what appears and what disappears. For example, a small-scale map may drop footpaths and buildings. Finally, look for missing or misleading scale and legend information. That is how you read any map with confidence. Next, we will look at common reading errors and how to correct them.
 fundootutor.comhackmath.nettransum.org+21 min
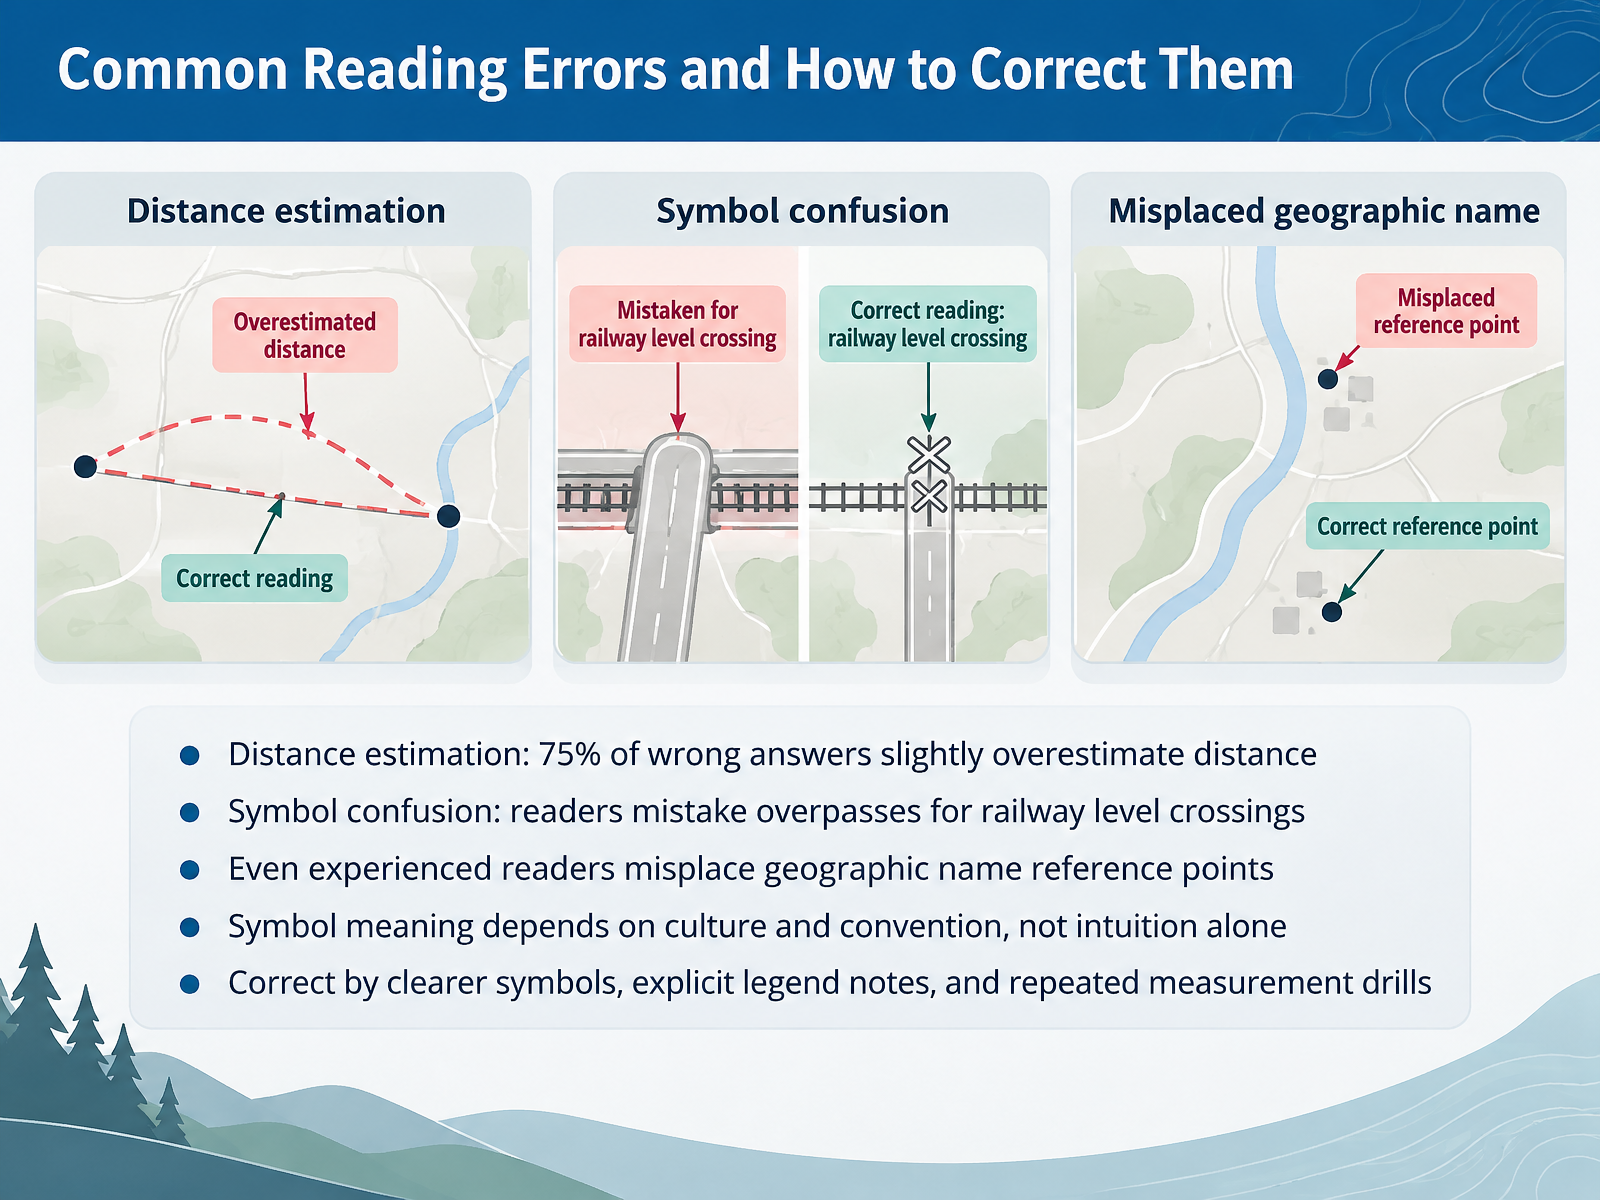
- 12Common Reading Errors and How to Correct ThemLet's look at the common reading errors you are likely to encounter, and how to correct them. Start with distance. In one study, more than seventy five percent of wrong answers slightly overestimated distance. The fix is simple. Measure with the scale bar, then measure again. Next, symbol confusion. Readers often mistake an overpass for a railway level crossing, because the larger symbol draws attention. So pause and check the legend before you decide. Even experienced readers misplace the reference point of a geographic name. Confirm which feature a label belongs to. Remember that symbol meaning depends on culture and convention, not intuition alone. A bush symbol can look like rocks. Correct these errors with clearer symbols, explicit legend notes, and repeated measurement drills. Next, we turn to teaching and assessing map literacy.
 1 min
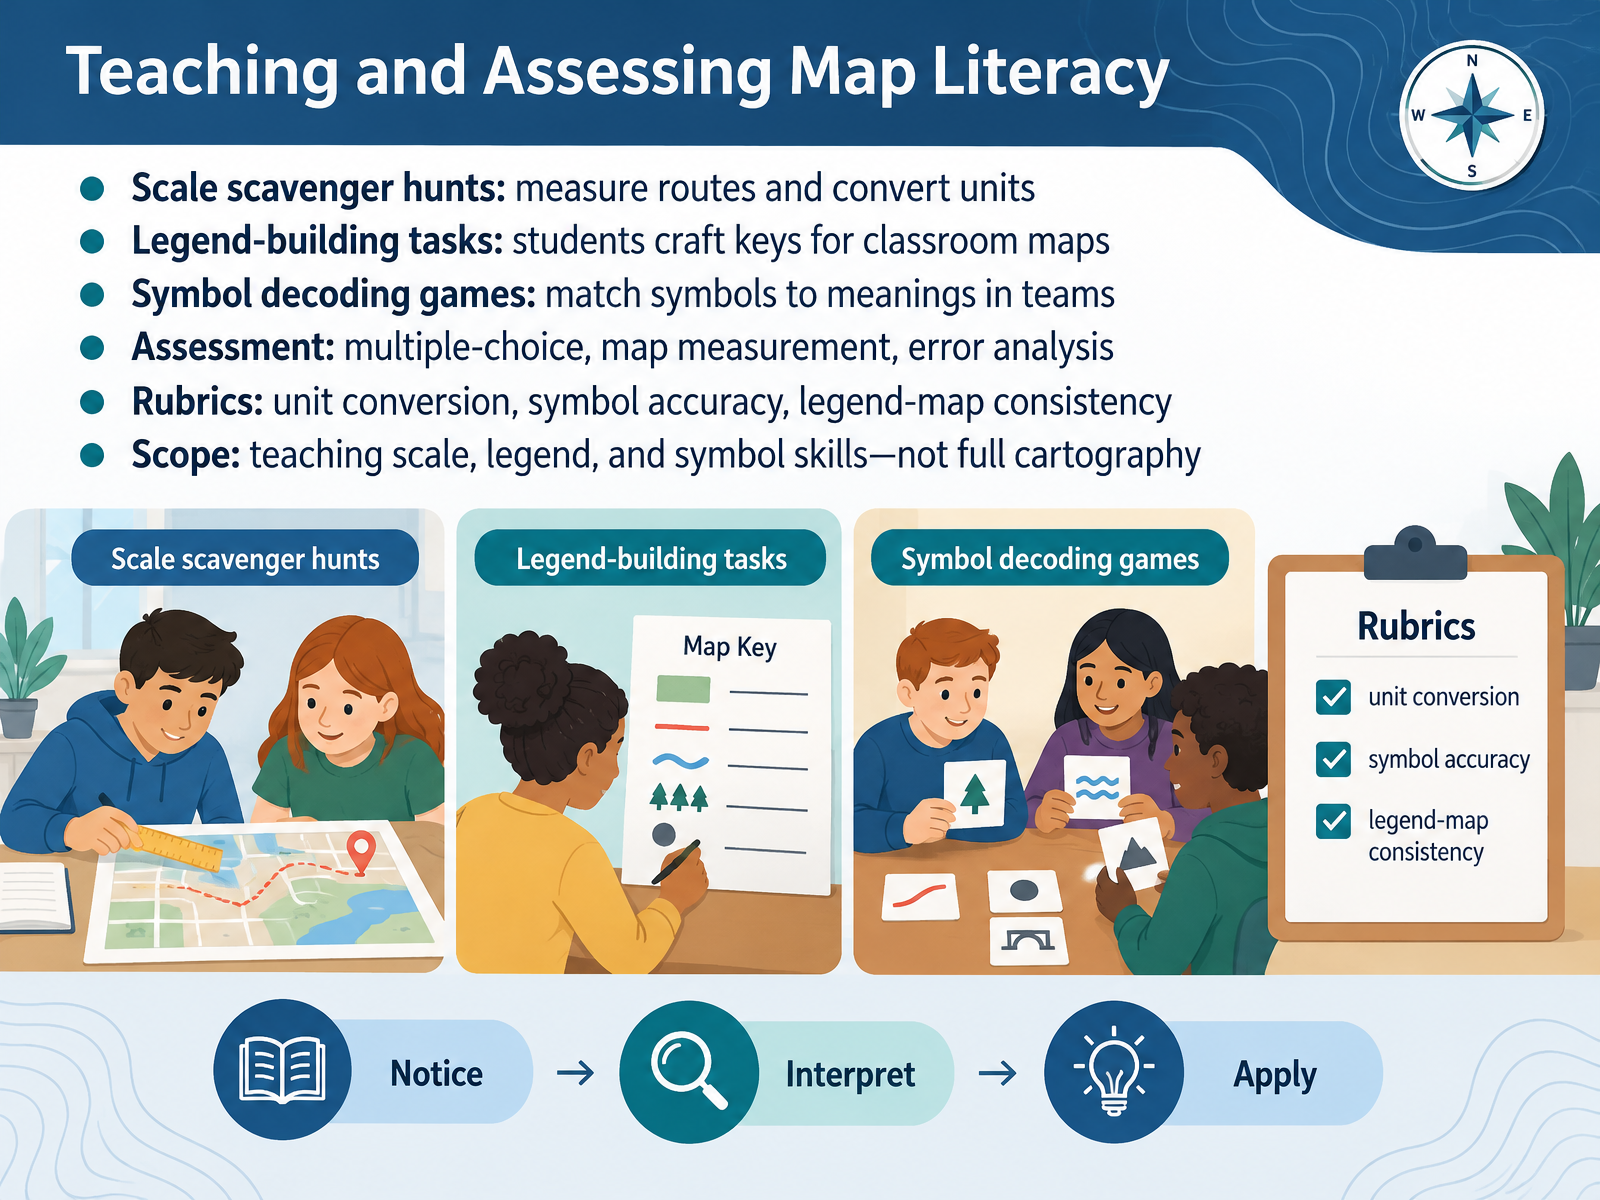
- 13Teaching and Assessing Map LiteracyNow let's look at how to teach and assess these skills. Start with a scale scavenger hunt. Students measure routes on a map, then convert map units into real-world distances. Next, have students build their own legends, creating a key for a classroom map. For symbols, try a team decoding game. Students match symbols to their meanings, and explain their reasoning. Then assess with multiple-choice questions, map measurement tasks, and error analysis. A clear rubric helps. Score unit conversion, symbol accuracy, and consistency between the legend and the map. Keep the scope focused on scale, legend, and symbol skills, not full cartography. In the next section, we'll bring it all together with key takeaways and common pitfalls.
 1 min
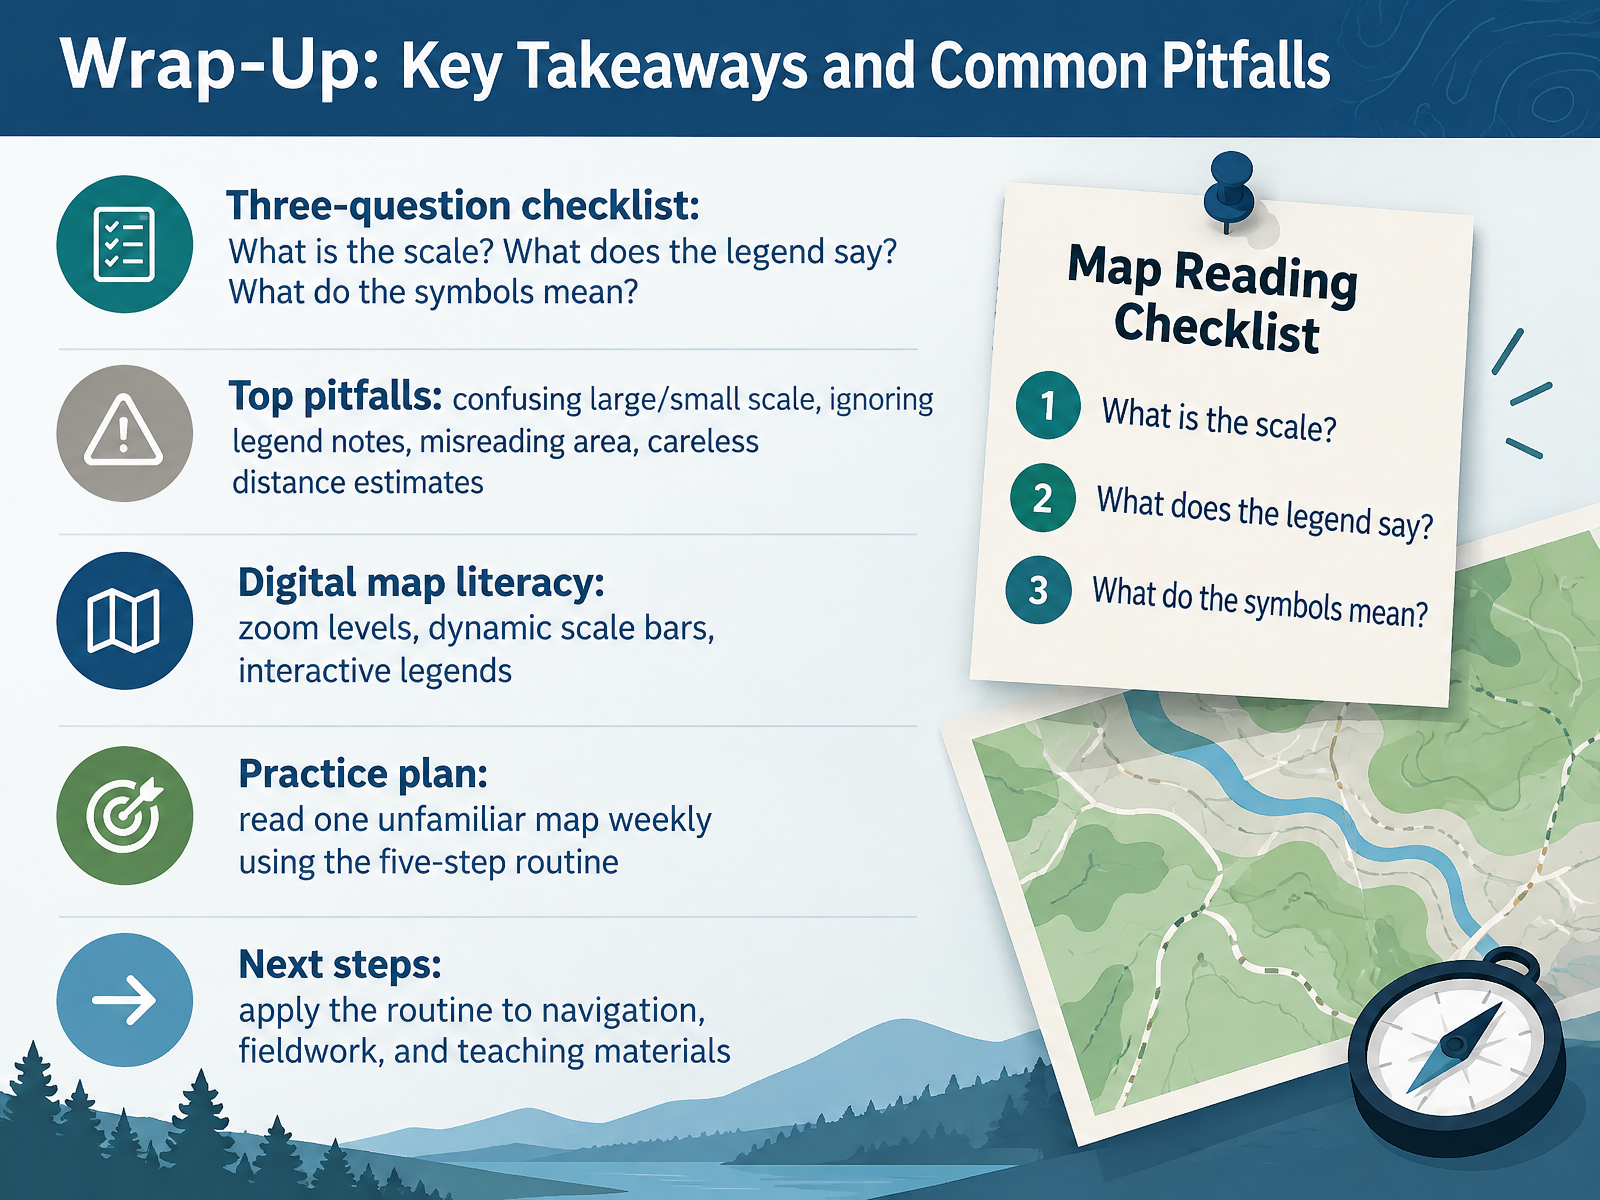
- 14Wrap-Up: Key Takeaways and Common PitfallsLet's bring everything together. Before trusting any map, run a quick three-question checklist. What is the scale? What does the legend say? And what do the symbols mean? Now watch for the top pitfalls. People confuse large and small scale, ignore notes in the legend, misread area, and estimate distance carelessly. Research shows most distance errors actually overestimate. With digital maps, watch the zoom level and the dynamic scale bar. That bar changes as you zoom, and interactive legends update too. Here is a simple practice plan. Read one unfamiliar map each week using the five-step routine. Then apply it to navigation, fieldwork, and your teaching materials. You now have the tools to read any map with confidence. Thank you for learning with me, and keep exploring.
 education.nationalgeographic.orgdocs.os.ukpubs.usgs.gov+22 min
Take the deck with you
Download this course as a file — free, no sign-up needed.
- PDF handoutEvery slide page, ready to print or share.15 pages · 3.8 MBDownload
- Narrated PowerPointThe deck that presents itself — every slide carries the digital human's narration video.15 pages · 13.3 MBDownload
- PowerPoint slidesThe full deck as a .pptx — open it in PowerPoint, Keynote, or Google Slides.15 pages · 3.7 MBDownload
Free to use in your own training — please keep the PersonWise credit page at the end.
Have your own deck? Turn it into a course
Sources consulted
Web sources consulted while building this course.
- Map Scale — education.nationalgeographic.org
- Choosing the best way to indicate map scale — esri.com
- Scale — doi.org
- Exploring maps — hdl.handle.net
- Scale | More than Maps — docs.os.uk
- Lessons on the Lake - Handout: Cartographic Information — pubs.usgs.gov
- 대한민국 국가지도집 — nationalatlas.ngii.go.kr
- Past Papers Worksheet P2 Map Scales IGCSE Mathematics 0580 — fundootutor.com
- Map Scale - Math Problems with Solutions — hackmath.net
- Map Scales — transum.org
- 2.2 Map Measurements to Ground Distances & Areas – Technical Math: Applications for the Environmental Sciences — openwa.pressbooks.pub
- Using Map Scales to Figure Distances and Areas - Activity — teachengineering.org
- Lying with Maps — doi.org
- Perceptual maps: the good, the bad and the ugly — repub.eur.nl
- UWF GIS4035 and GIS3015 Course interface: Lab 1 Part 2 Map Critique (Bad Map) — jmgis3015.blogspot.com
- Making Maps–A Visual Guide to Map Design with GPS — doi.org
- https://docs.os.uk/more-than-maps/geographic-data-visualisation/guide-to-cartography/map-legends — docs.os.uk
- Cartographic design: Legends — esri.com
- Developing map marginalia design recommendations for the Alaska Division of Geological & Geophysical Surveys — doi.org
- Marginalia Information | Intergovernmental Committee on Surveying and Mapping — icsm.gov.au