Begin
13 pages · ~26 min
Marketing Analytics and Metrics
Equips marketing professionals to measure and interpret key analytics metrics, enabling data-driven decisions and campaign performance optimization.
A digital instructor presents all 13 pages. Hold “Ask” at any point and ask out loud — the answer comes from this course. No sign-up needed.
What you’ll learn
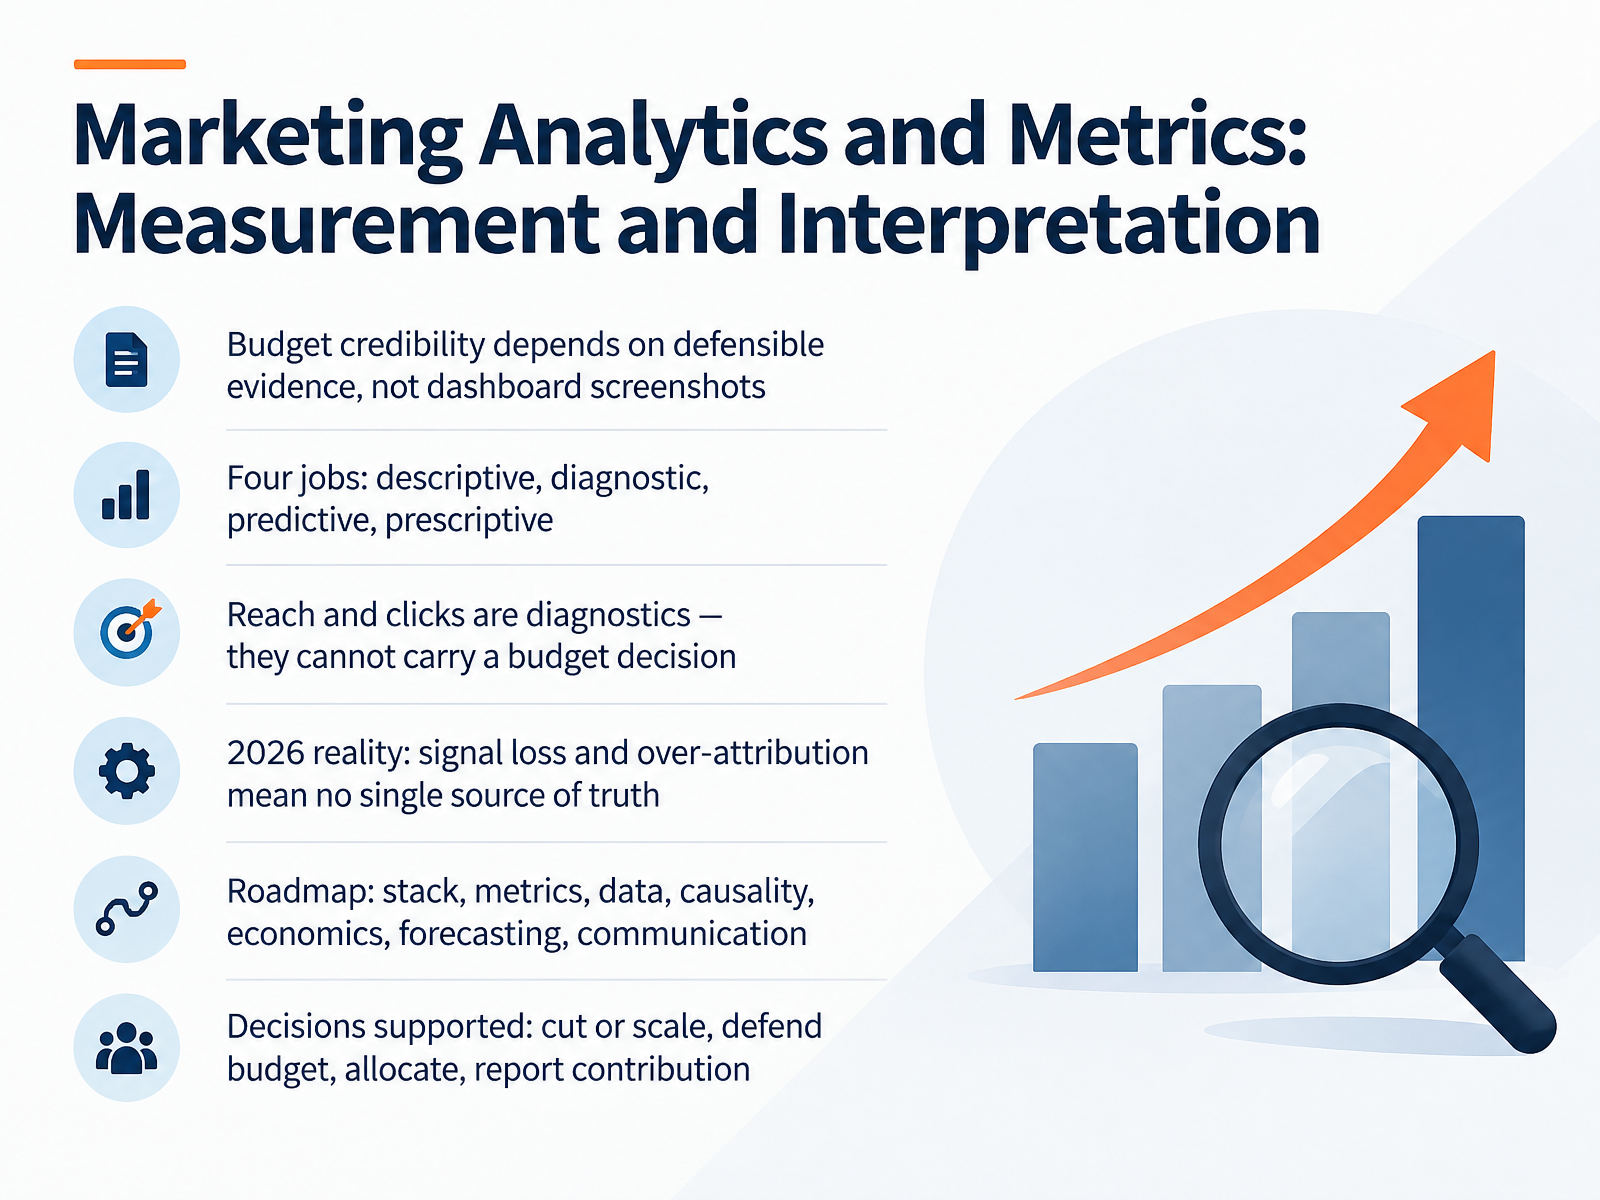
- 01Marketing Analytics and Metrics: Measurement and InterpretationWelcome. This course is about making marketing measurement defensible enough to carry a budget decision. Not prettier dashboards, but evidence you can stand behind in a room with finance. Over the next twelve slides, we build that capability together. First, the core idea. Reach and clicks are diagnostics. They tell you where to look next. They cannot carry a budget decision on their own, because they say nothing about conversion, customer growth, or revenue. Next, four jobs to keep separate. Descriptive tells you what happened. Diagnostic tells you why. Predictive tells you what is likely next. Prescriptive tells you what to do. Mixing those jobs in one report is how conversations stall. So what is the 2026 reality? Signal loss and over-attribution mean no single source of truth. Triangulation is the standard, and governance is what makes it credible. Here is the roadmap: stack, metrics, data, causality, economics, forecasting, and communication. Each one supports a real decision. Cut or scale. Defend the budget. Allocate spend. Report contribution. Watch for the temptation to present a screenshot as proof. Use this course to build the audit trail instead. Next, we look at the analytics maturity path, from reactive reporting to decision support.gartner.cominnovationvista.commixpanel.com+22 min
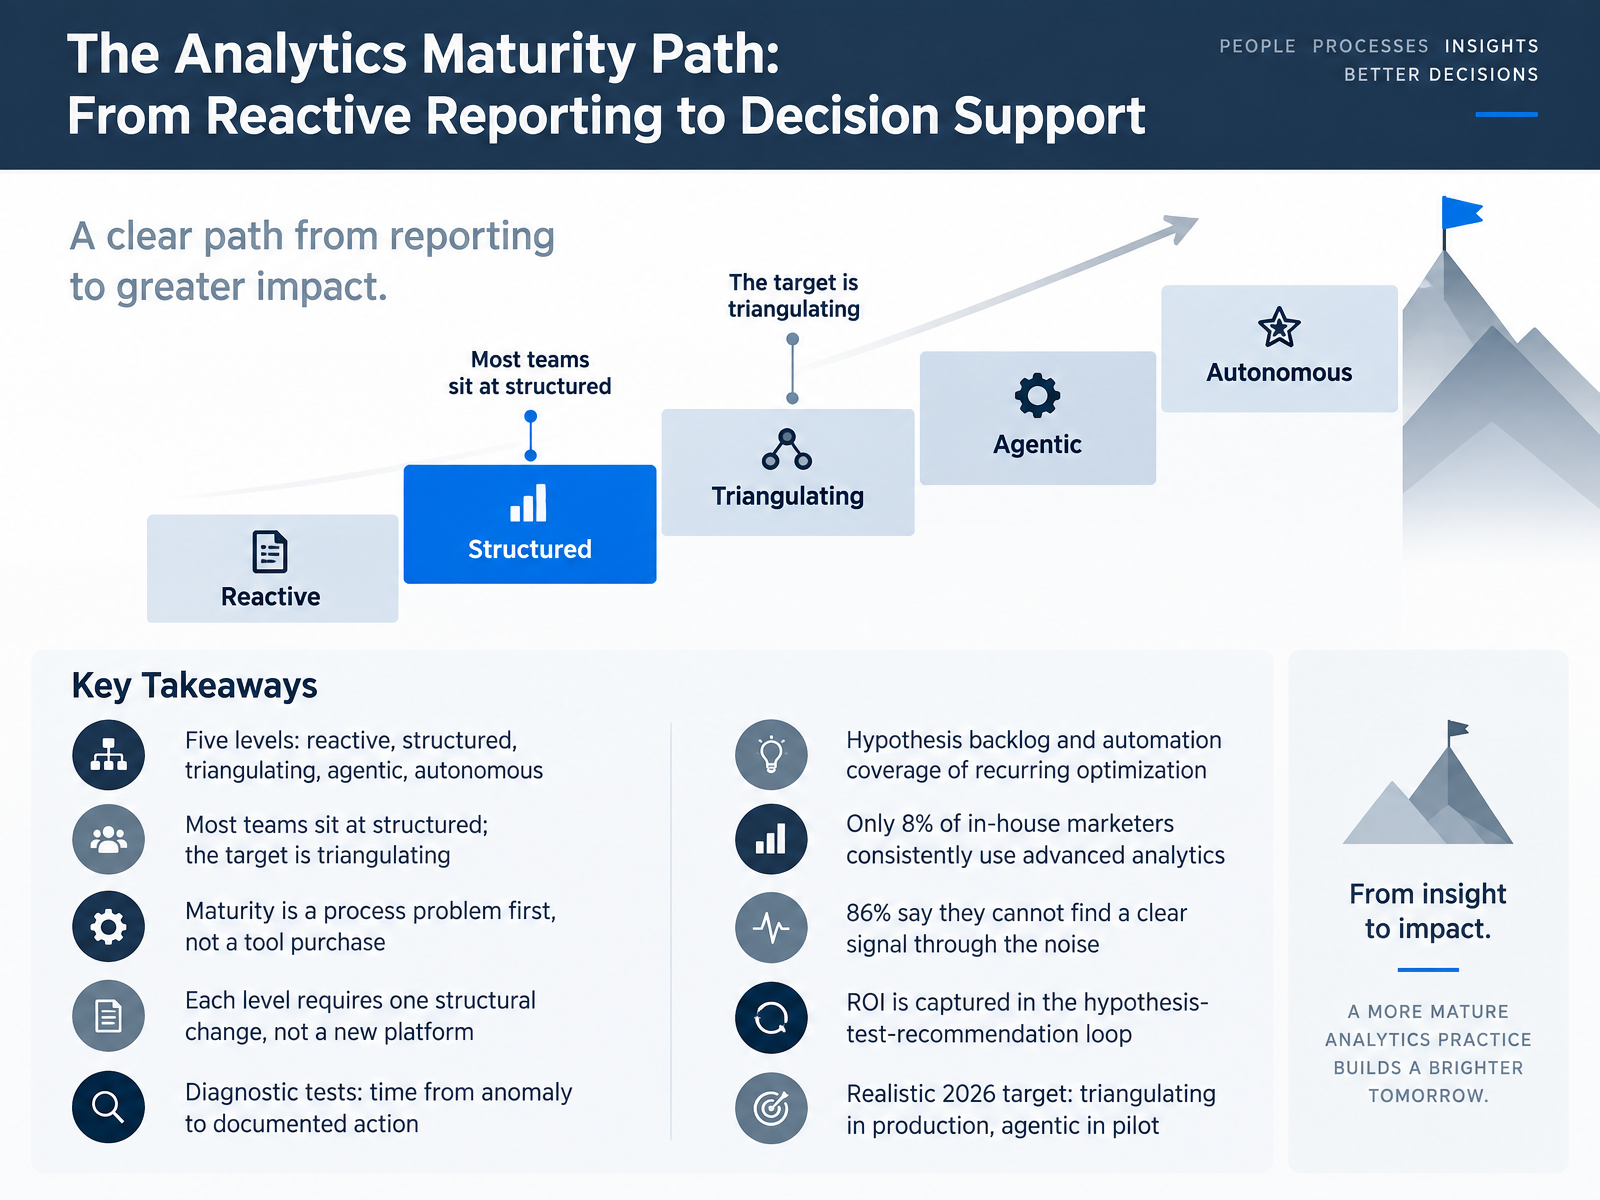
- 02The Analytics Maturity Path: From Reactive Reporting to Decision SupportNext, let's look at where your team actually sits on the analytics maturity path. There are five levels: reactive, structured, triangulating, agentic, and autonomous. Most teams sit at structured. The target is triangulating, because that is where you blend marketing mix modeling, multi-touch attribution, and incrementality testing into one allocation decision. Here is the important part. Maturity is a process problem first, not a tool purchase. Each level requires one structural change, not a new platform. To diagnose yourself, run two tests. First, how long from anomaly to documented action? If it takes days, you are still reactive. Second, look at your hypothesis backlog and your automation coverage of recurring optimization. The picture is sobering. Only eight percent of in-house marketers consistently use advanced analytics, and eighty-six percent say they cannot find a clear signal through the noise. So what? Return on investment is captured in the hypothesis, test, and recommendation loop. A realistic 2026 target: triangulating in production, agentic in pilot. Then move forward. The Measurement Stack: Channels, Funnels, and Customer Journeys.
 gartner.cominnovationvista.commixpanel.com+22 min
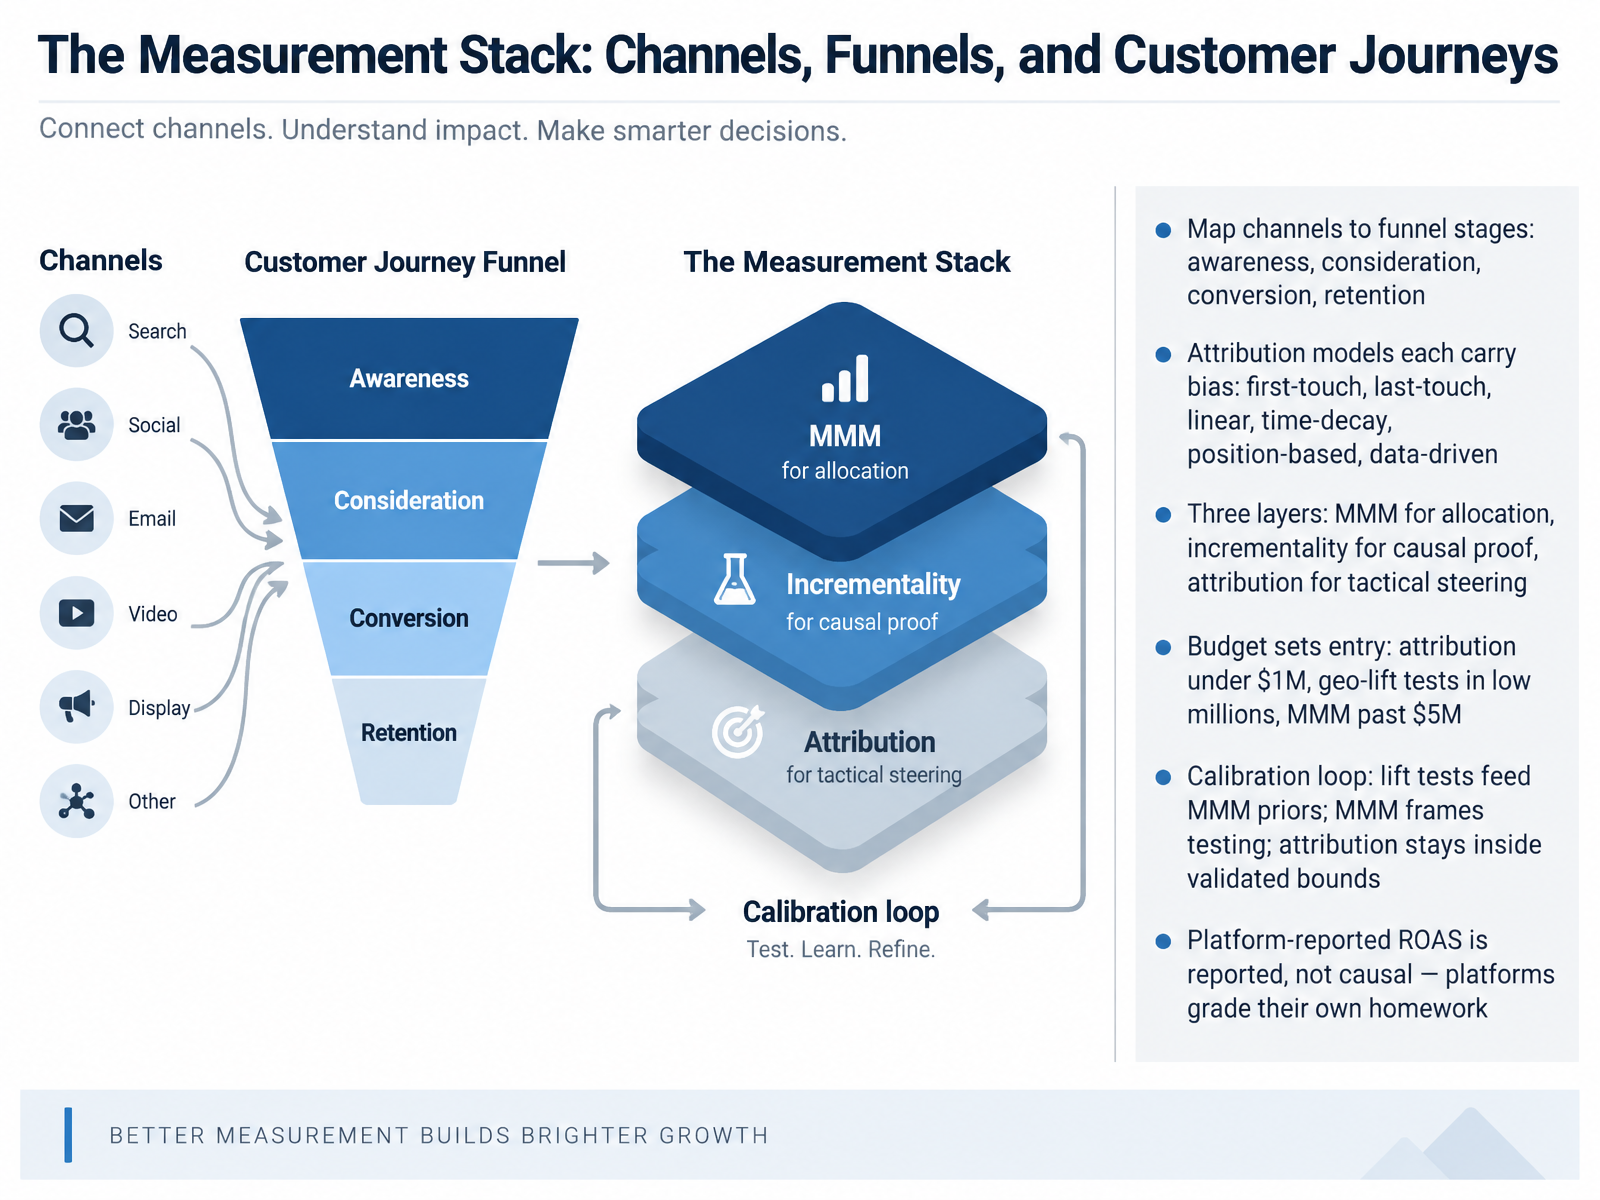
 - 03The Measurement Stack: Channels, Funnels, and Customer JourneysNow let's look at the measurement stack. Start by mapping each channel to a funnel stage: awareness, consideration, conversion, retention. Then accept a hard truth. Every attribution model carries bias. First-touch over-credits discovery. Last-touch over-credits intent capture. Linear, time-decay, and position-based each add their own distortion. So think in three layers, not one. MMM splits the portfolio. Incrementality proves causal lift. Attribution steers tactics inside channels you have already validated. Budget sets your entry point. Under one million dollars, attribution plus a few tests is enough. In the low millions, add geo-lift tests. Past five million, run a full MMM. Then wire a calibration loop. Lift tests feed MMM priors, MMM frames which channels to test, and attribution stays inside those validated bounds. And hold one rule above the rest. Platform-reported ROAS is reported, not causal. Platforms grade their own homework. Use those numbers for steering, never for strategy. Next, we'll cover choosing the right metrics, leading, lagging, and diagnostic.
 digitalapplied.comcometly.comthemarketingjuice.com+22 min
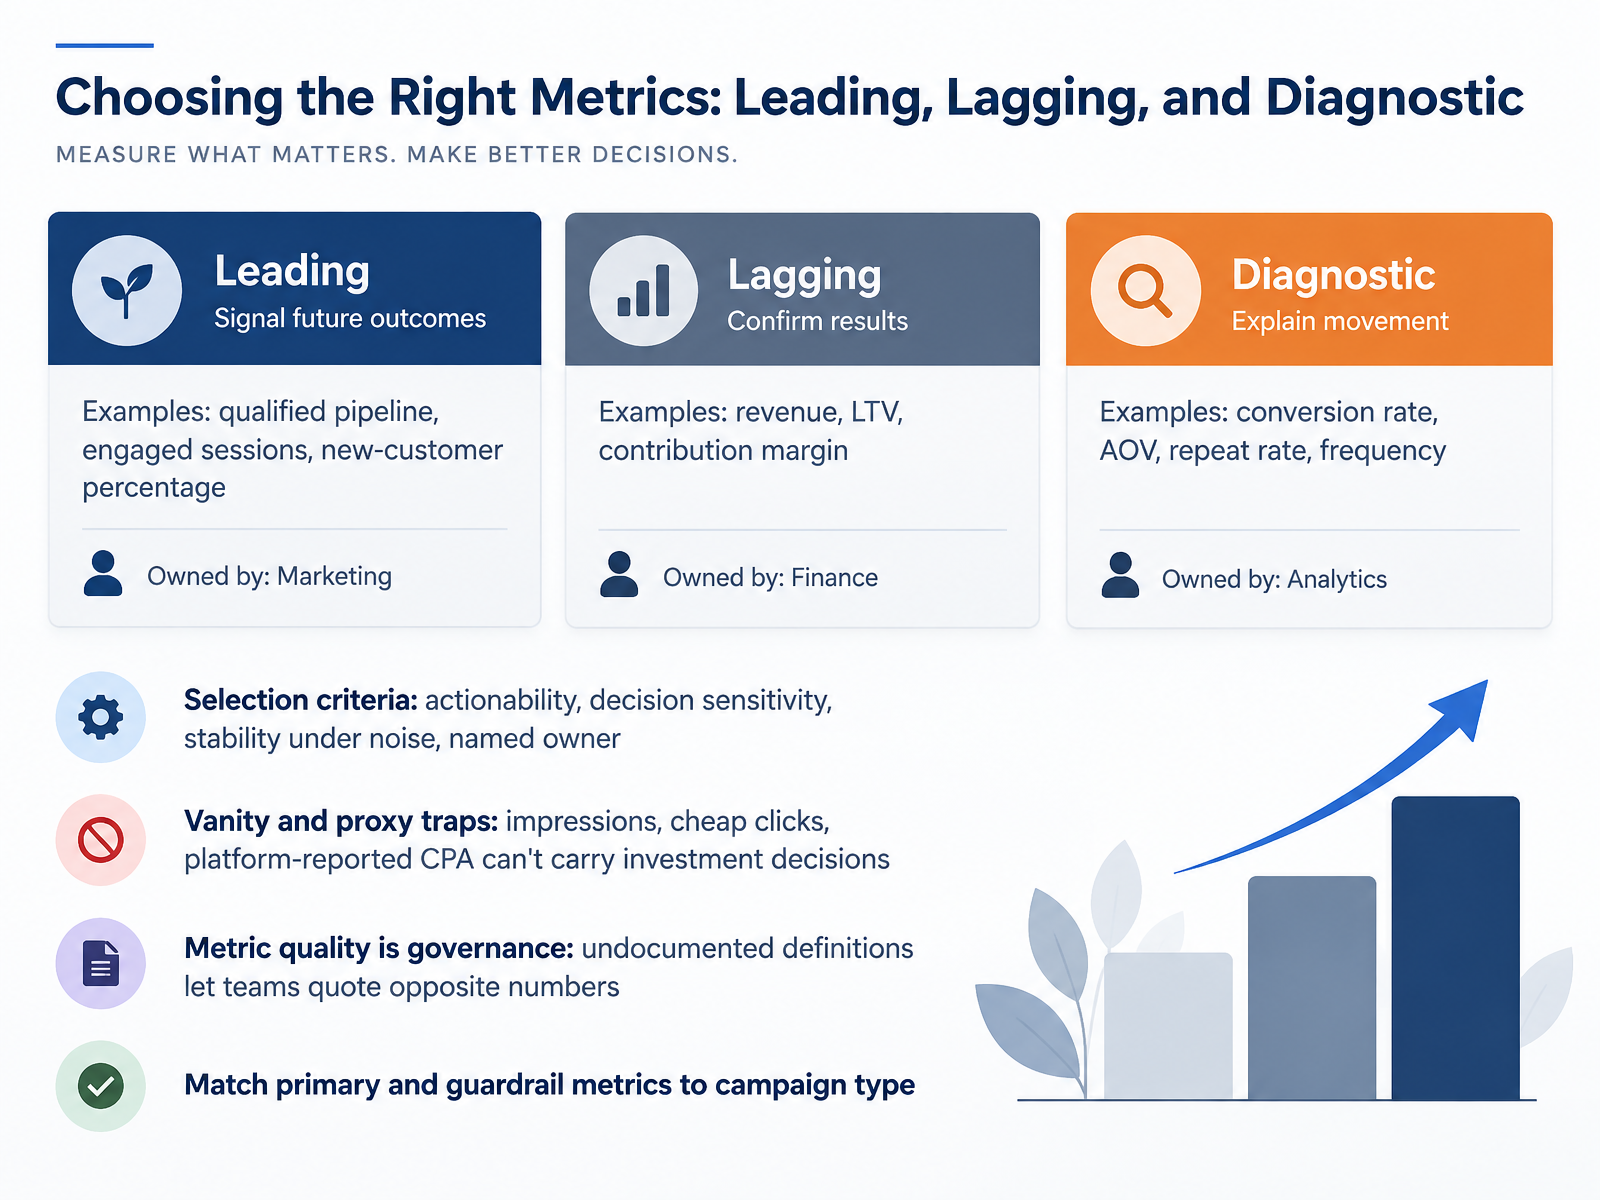
 - 04Choosing the Right Metrics: Leading, Lagging, and DiagnosticNext, let's talk about choosing the right metrics. Leading indicators signal future outcomes, things like qualified pipeline or new-customer percentage. Lagging indicators confirm results, like revenue and contribution margin. Diagnostic metrics explain the movement in between, such as conversion rate, average order value, repeat rate, and purchase frequency. So how do you choose? Apply four criteria. Is it actionable? Is it sensitive to your decisions? Is it stable under noise? And does it have a named owner? Watch for vanity and proxy traps. Impressions and cheap clicks cannot carry an investment decision. Platform-reported cost per acquisition is typically inflated, so use blended numbers instead. Remember, metric quality is governance. Undocumented definitions let teams quote opposite numbers from the same data. Finally, match your primary and guardrail metrics to campaign type. That keeps every metric tied to a decision it can actually support. Coming up next, Data Foundations: Tracking, Hygiene, and Privacy Constraints.
 eightx.coadmetrics.ioshopify.com+22 min
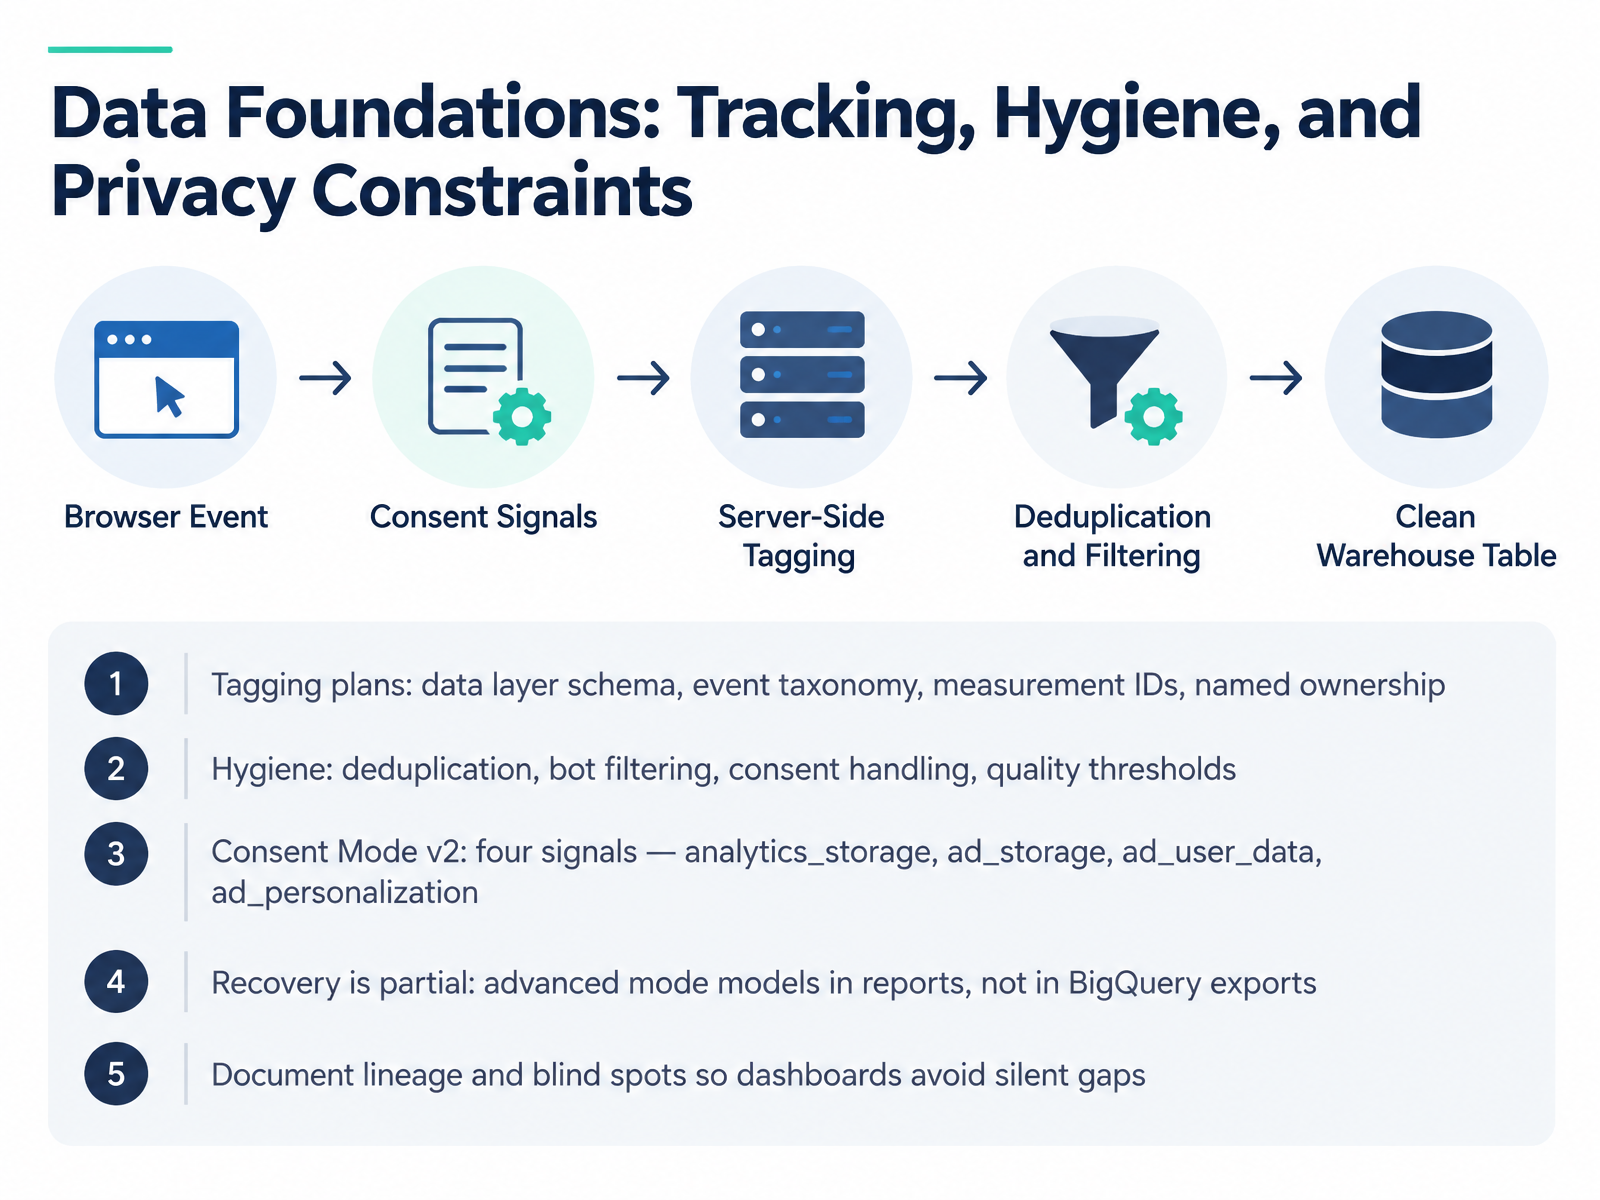
 - 05Data Foundations: Tracking, Hygiene, and Privacy ConstraintsNext, let's ground everything in the data layer itself. Start with a tagging plan. Define your data layer schema, your event taxonomy, and your measurement IDs. Name one owner per layer, because unclear ownership is where silent gaps begin.
Then build hygiene into the pipeline. Deduplicate, filter bots, handle consent correctly, and set quality thresholds you can actually monitor.
On consent, watch the four Consent Mode signals. Analytics storage, ad storage, ad user data, and ad personalization. If any default or update call is wrong, the signal is wrong, and the loss shows up quietly in conversions and audiences.
So what about recovery? It is partial. Advanced mode models users and sessions in blended reports, but that modeled data does not appear in your BigQuery export. Treat exports as observed data only.
Finally, document lineage and blind spots. Use this when dashboards feed budget decisions, so nobody mistakes a modeled estimate for a measured fact. That discipline is what turns clean data into trustworthy insight, which brings us to our next slide, From Data to Insight: Interpreting Performance Reports.
 datascale.desealmetrics.comfkks.com+22 min
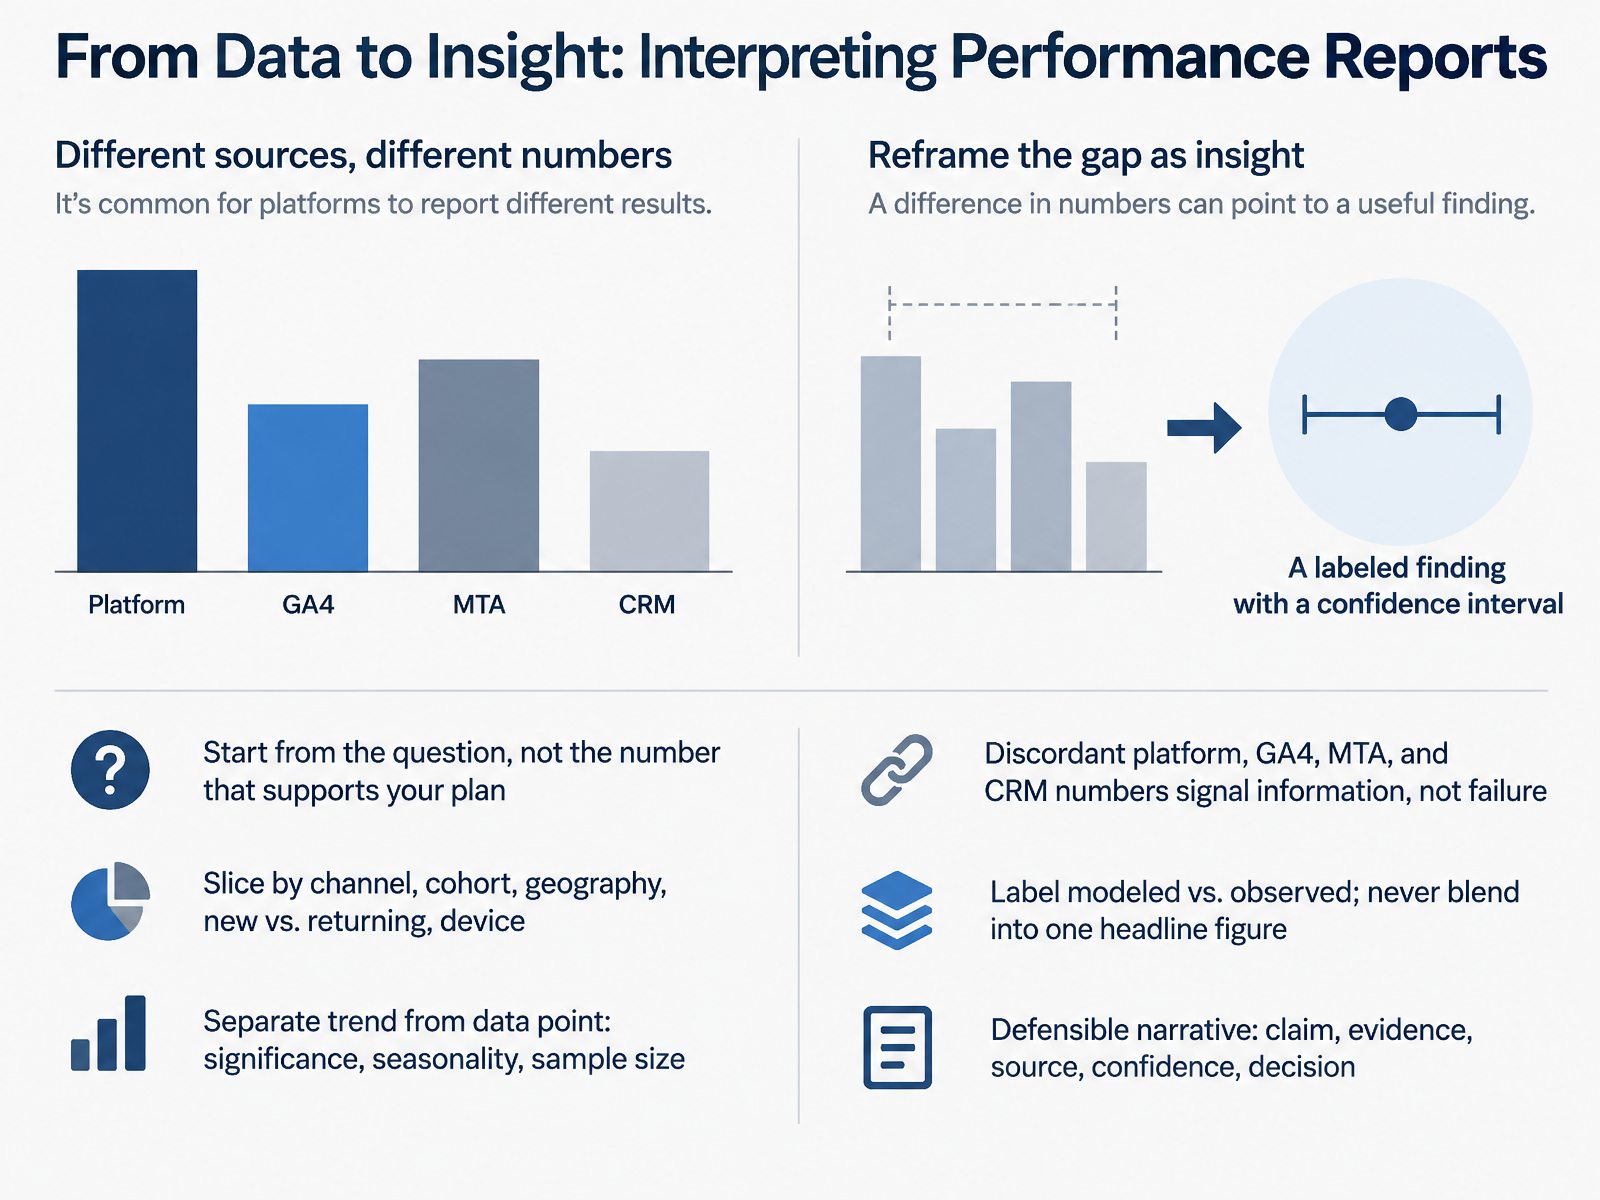
 - 06From Data to Insight: Interpreting Performance ReportsNext, let's turn data into insight. Start from the question, not the number that supports your plan. So before you open the report, write down the decision you're trying to make. Then slice. Break results down by channel, cohort, geography, new versus returning users, and device. Aggregates hide the story. Next, separate trend from a single data point. Check significance, seasonality, and sample size before you react. So what happens when platform, GA4, MTA, and CRM numbers disagree? That discordance is information, not failure. Each system sees a different slice of the journey. Label modeled versus observed data, and never blend them into one headline figure. When you present, build a defensible narrative: claim, evidence, source, confidence, then the decision. Use this when you need alignment across teams. Watch for anyone quoting one blended number as truth. That ends the interpretation step. Causality: Experiments, Incrementality, and Lift Measurement.
 digitalapplied.comcometly.comthemarketingjuice.com+22 min
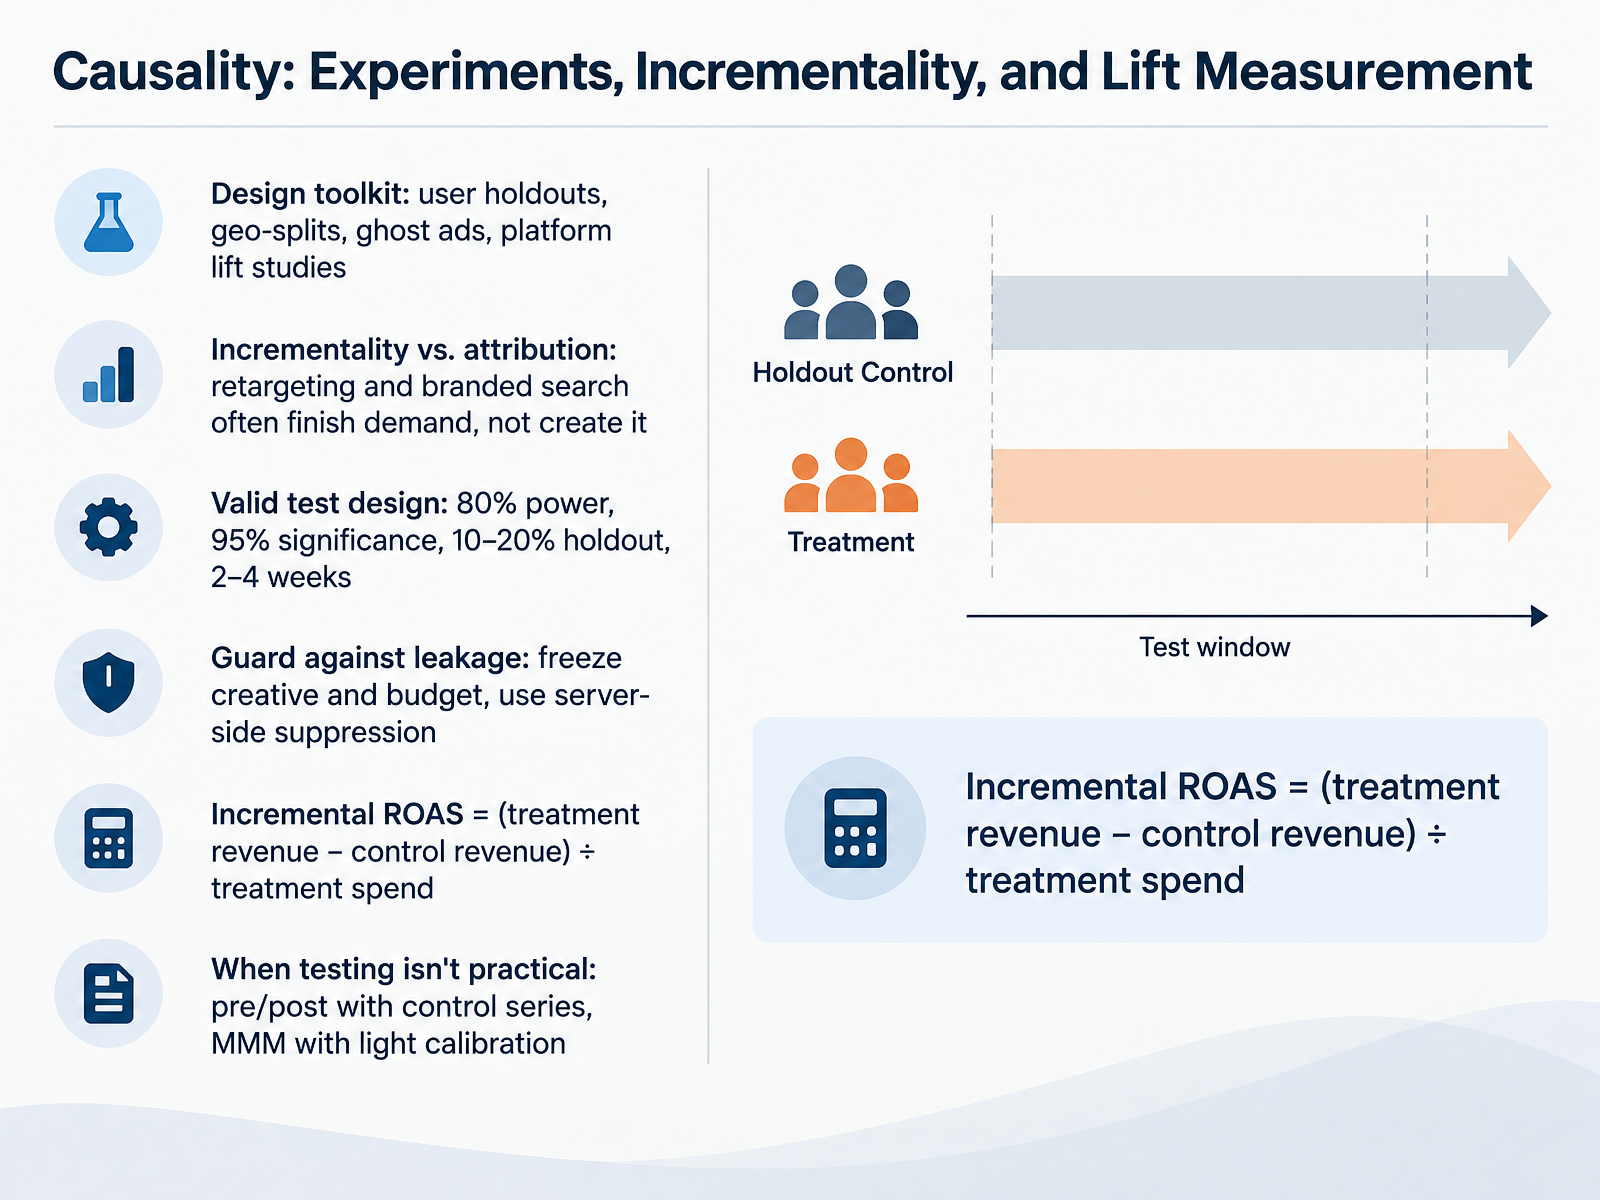
 - 07Causality: Experiments, Incrementality, and Lift MeasurementNext, causality. Attribution tells you what got credit. Incrementality tells you what actually changed behavior. Design your test with a holdout, ten to twenty percent of users or matched geographies, run it two to four weeks, and target eighty percent power at ninety-five percent significance. Then compute incremental return on ad spend: treatment revenue minus control revenue, divided by treatment spend. Expect that number to run lower than platform return on ad spend, because retargeting and branded search often finish demand rather than create it. Freeze creative and budget, and use server-side suppression to prevent leakage. When testing isn't practical, use pre and post with a control series, or lean on marketing mix modeling with light calibration. So what: test the channels where attribution looks too good to be true. That brings us to unit economics, covering CAC, LTV, ROAS, and payback.
 digitalapplied.comcometly.comthemarketingjuice.com+22 min
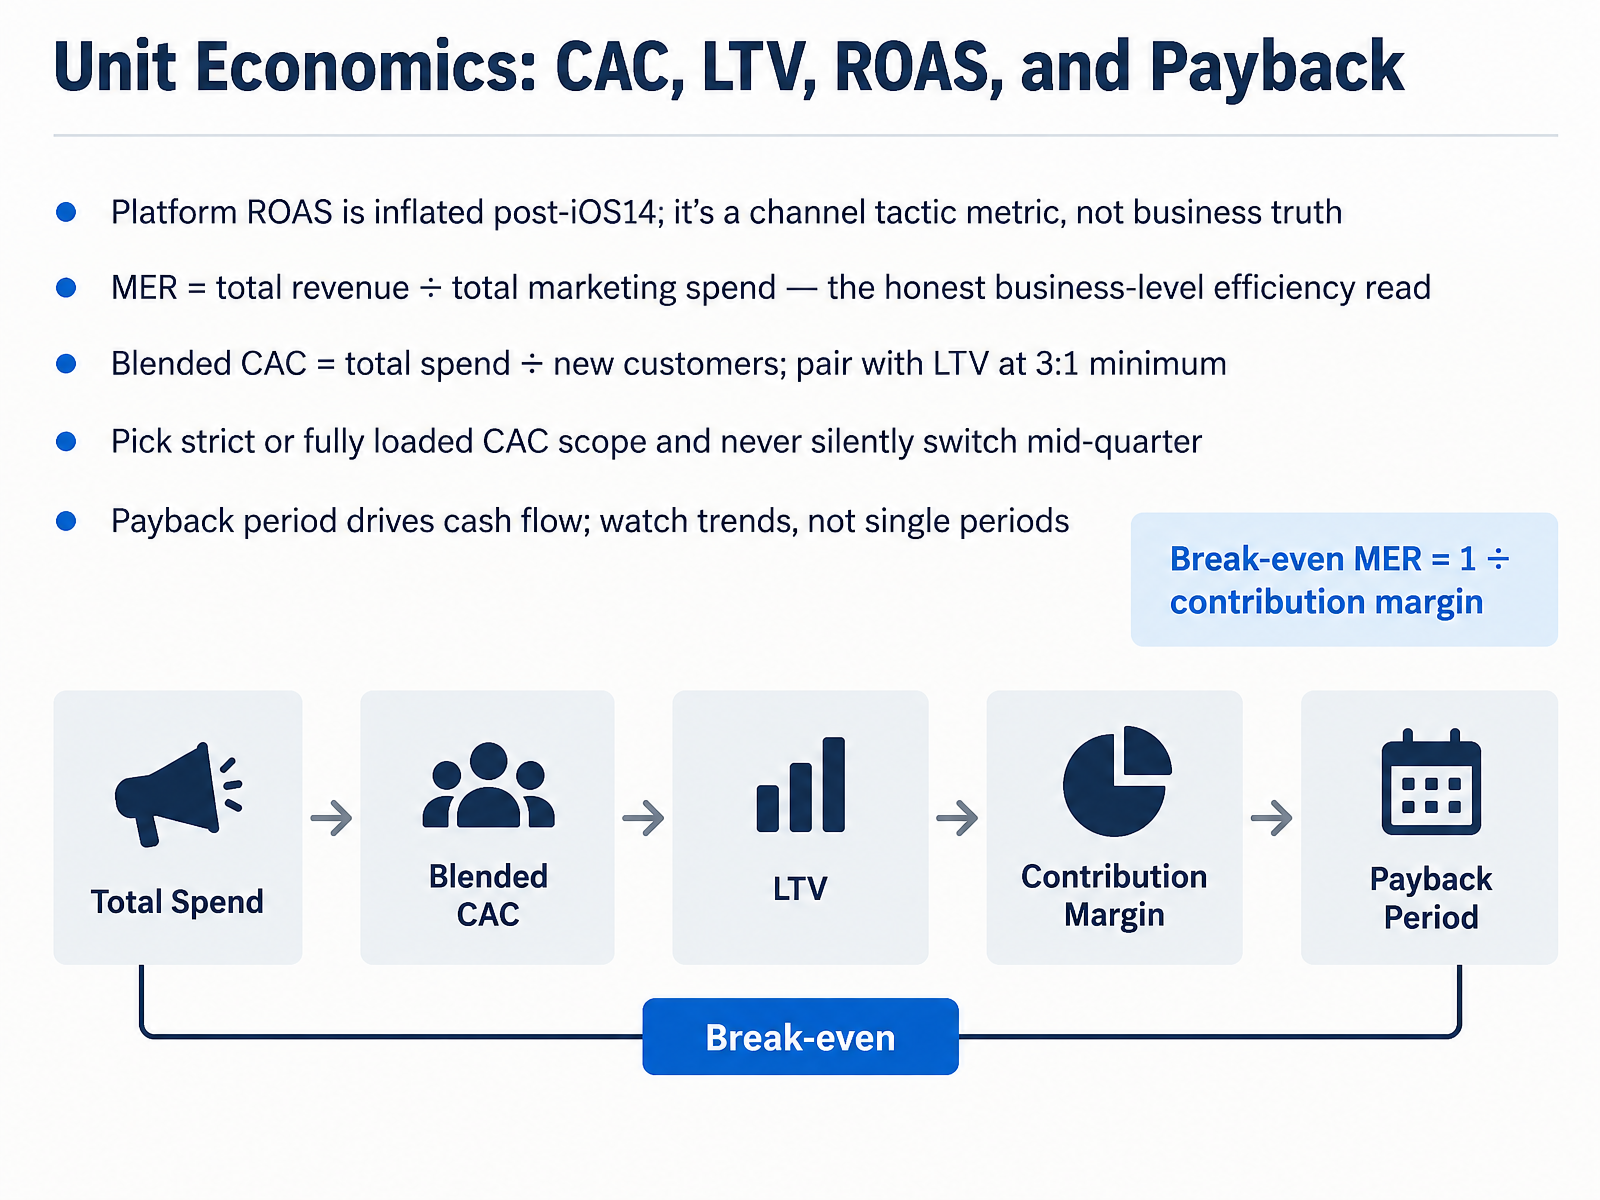
 - 08Unit Economics: CAC, LTV, ROAS, and PaybackNext, let's look at unit economics: C A C, L T V, R O A S, and payback. Start with R O A S. Platform-reported R O A S has been inflated since iOS fourteen. Treat it as a channel tactic metric, not business truth. So what is the honest read? M E R, marketing efficiency ratio. It equals total revenue divided by total marketing spend. Your break-even M E R equals one divided by contribution margin. If your margin is twenty five percent, break-even is four. Next, blended C A C equals total spend divided by new customers. Pair it with L T V at a minimum of three to one. Pick strict or fully loaded C A C scope and never switch mid-quarter. Watch for payback period, because it drives cash flow. Read the trend over several periods, not a single month. That gives you a stable read on growth efficiency. Now, forecasting and budget allocation under uncertainty.
 eightx.coadmetrics.ioshopify.com+22 min
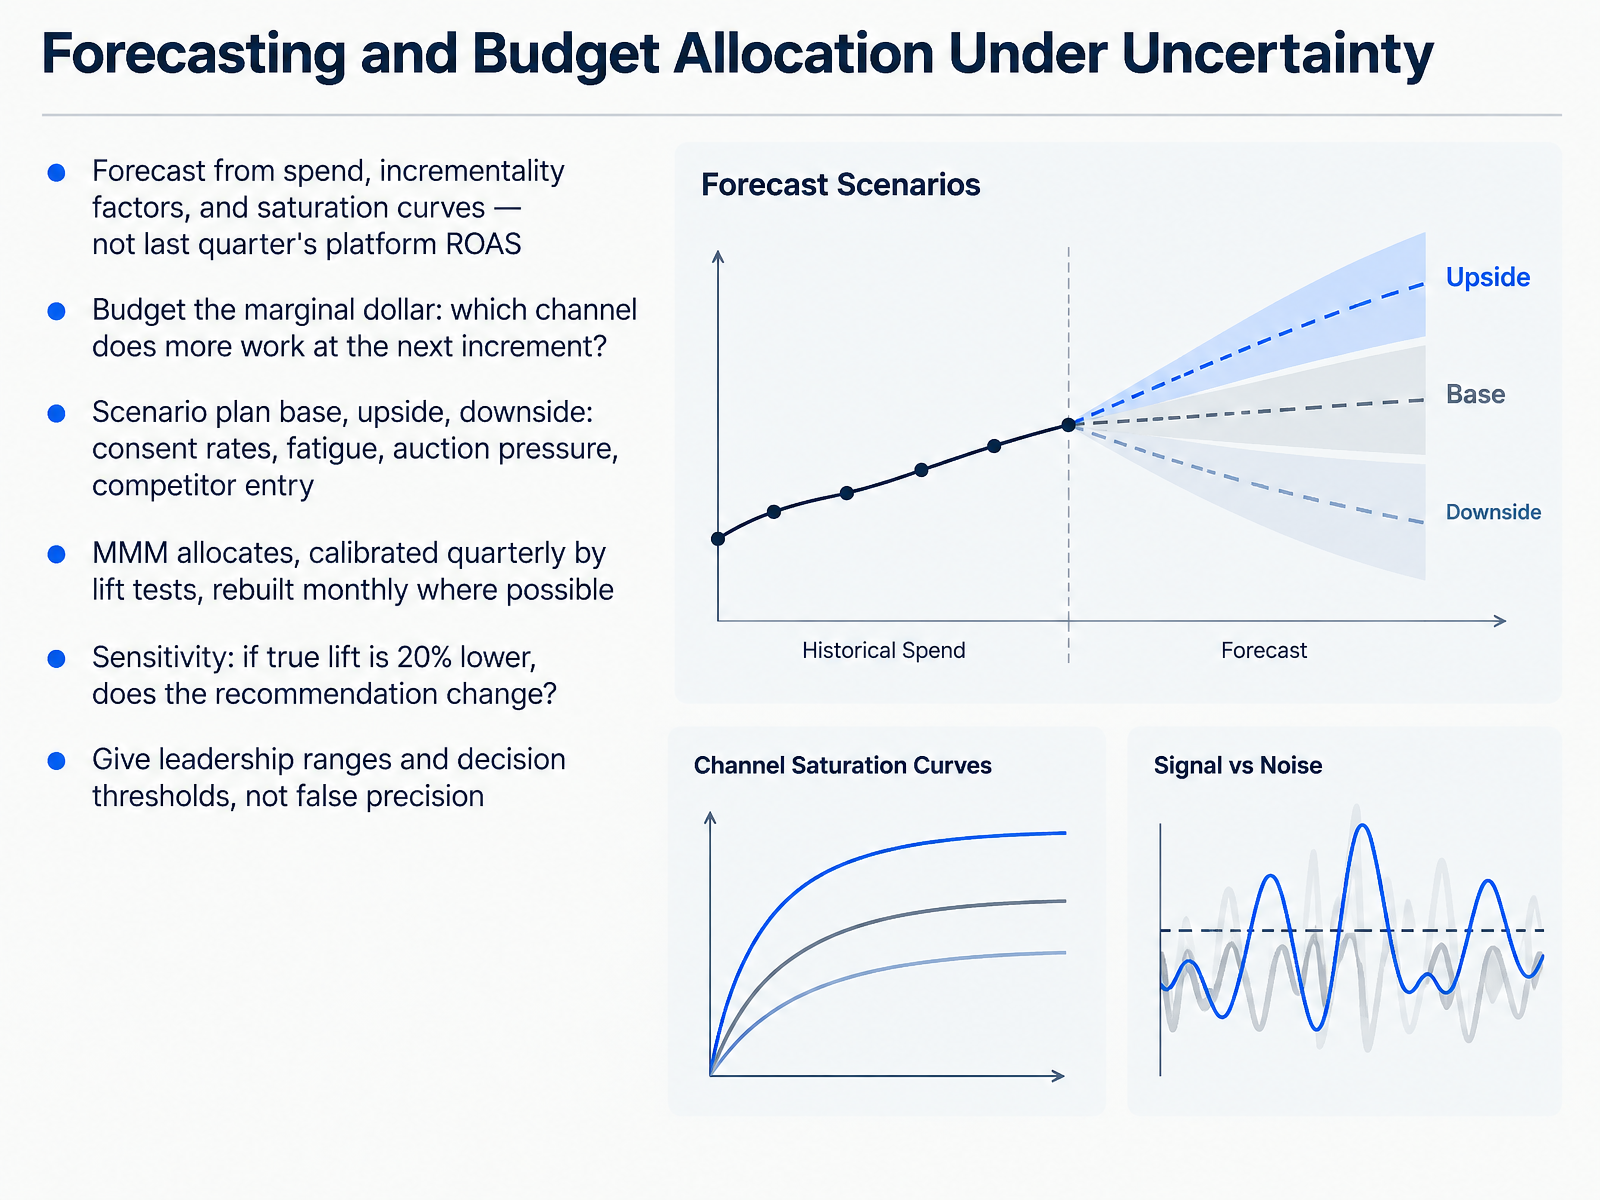
 - 09Forecasting and Budget Allocation Under UncertaintyNow let's talk forecasting and budget allocation under uncertainty. Stop forecasting from last quarter's platform ROAS. That number is reported, not causal. Build your forecast instead from spend, incrementality factors, and saturation curves. Then budget the marginal dollar. Ask one question: which channel does more work at the next increment? Next, scenario plan three cases: base, upside, and downside. Stress the inputs that move most, like consent rates, creative fatigue, auction pressure, and competitor entry. Use your marketing mix model to allocate, calibrate it quarterly with lift tests, and rebuild it monthly where possible. Now run sensitivity. If true lift is twenty percent lower, does the recommendation change? If it does, your decision is fragile. So what should leadership see? Ranges and decision thresholds, not false precision. Use this when a budget shift is material. Watch for point estimates presented as certainty. Next, we'll look at communicating results through stakeholder ready reporting.
 digitalapplied.comcometly.comthemarketingjuice.com+22 min
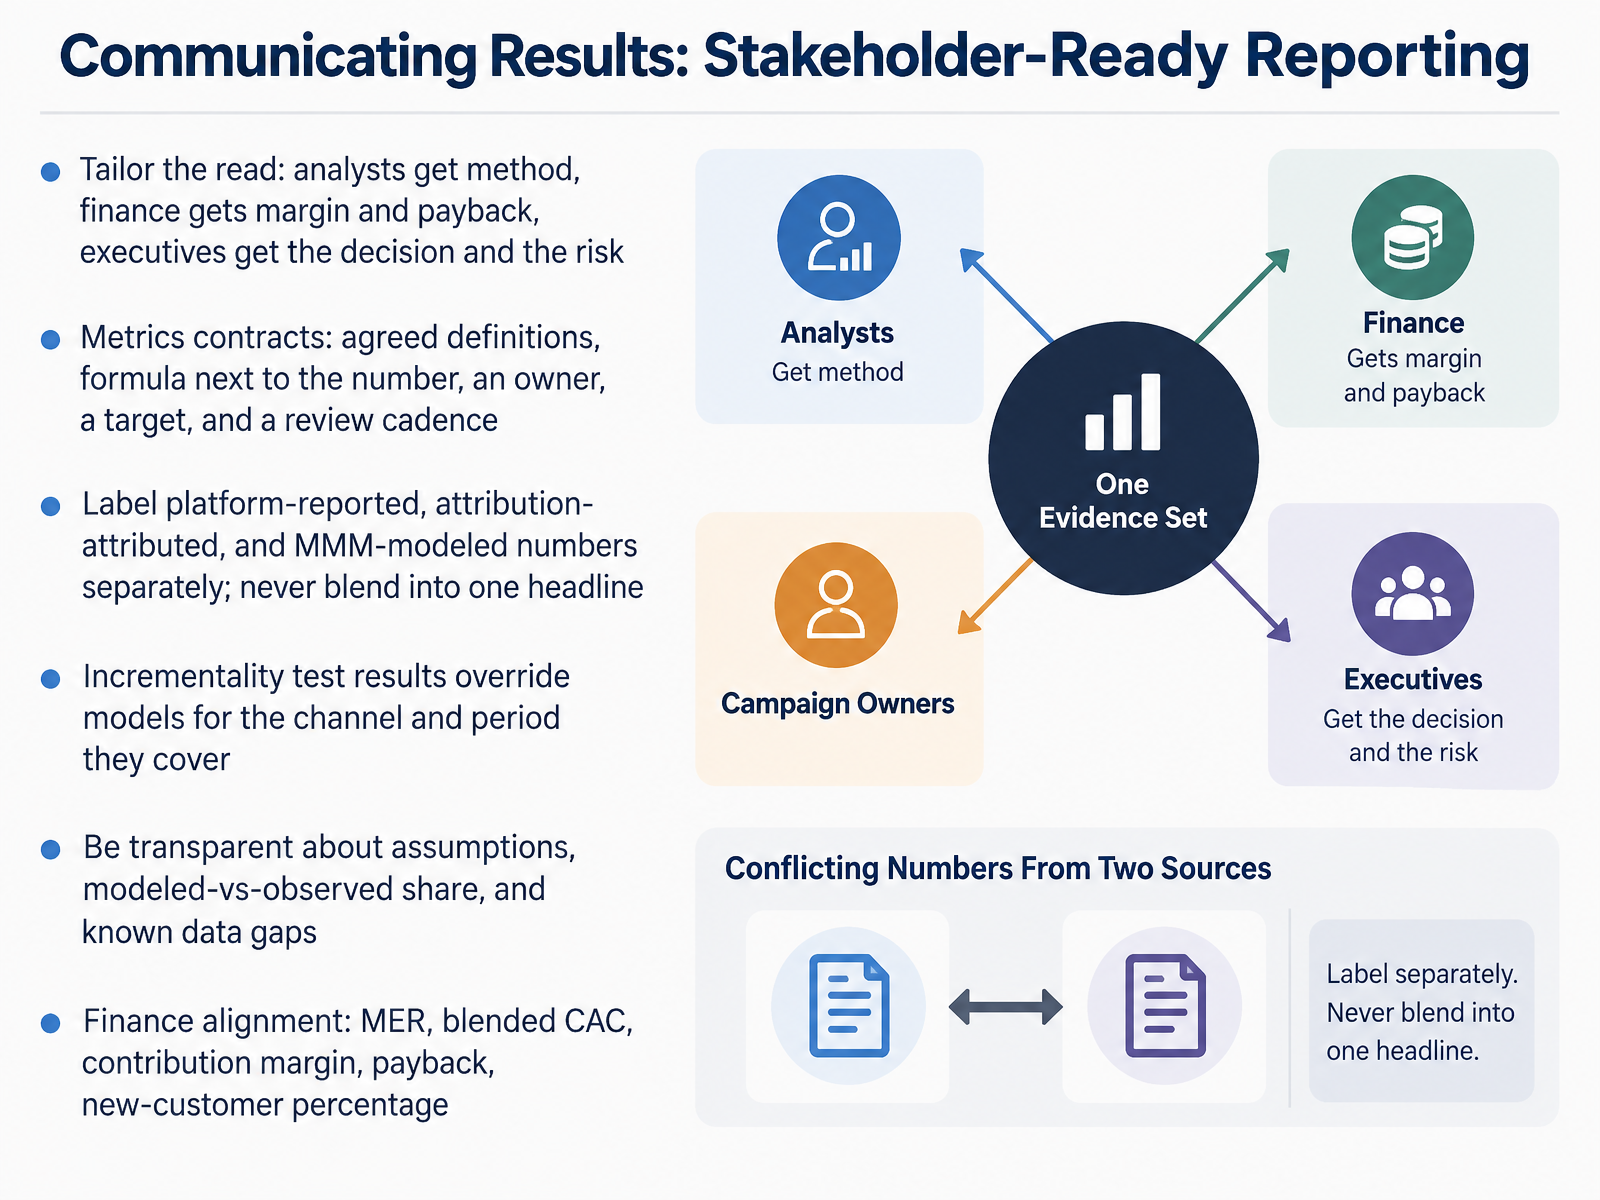
 - 10Communicating Results: Stakeholder-Ready ReportingNext, let us talk about communicating results in a way that stakeholders can actually use. Tailor the read to the audience. Analysts want the method. Finance wants margin and payback. Executives want the decision and the risk.
Back your numbers with a metrics contract. That means agreed definitions, the formula written next to the number, a named owner, a target, and a review cadence.
Always label platform reported, attribution attributed, and M M M modeled numbers separately. Never blend them into one headline. Use this when a channel has an incrementality test. For the channel and period that test covers, the test result overrides the model.
Watch for hidden assumptions. Be transparent about modeled versus observed share and any known data gaps. And align with finance on shared language. Marketing efficiency ratio, blended C A C, contribution margin, payback, and new customer percentage.
So what is the takeaway? Stakeholder ready reporting separates sources, states its limits, and speaks the language of the people making the decision.
Now, let us turn to the operating rhythm that keeps this working. Operating Rhythm: Governance, Tooling, and Continuous Improvement.
 eightx.coadmetrics.ioshopify.com+22 min
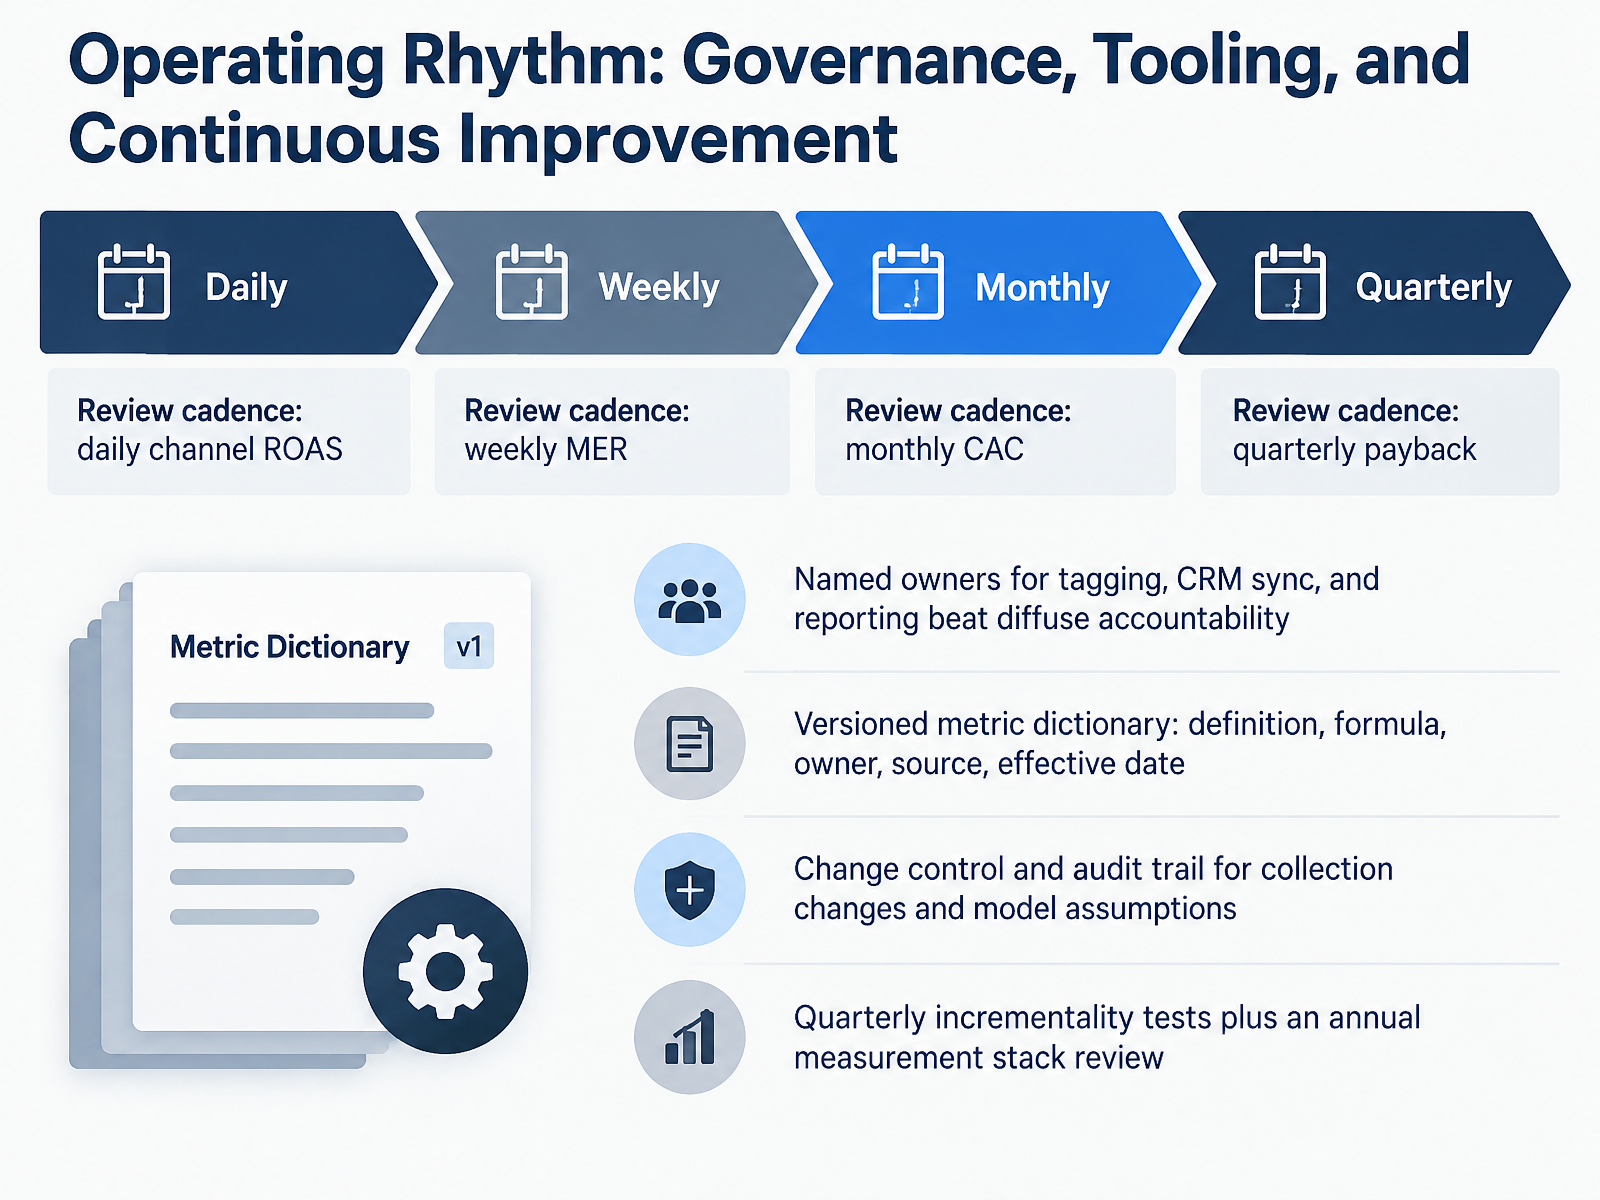
 - 11Operating Rhythm: Governance, Tooling, and Continuous ImprovementNow let's talk about your operating rhythm. Metrics only drive decisions when there's a cadence behind them. So set daily channel ROAS reviews, weekly MER, monthly CAC, and quarterly payback. Each one answers a different question, and each one needs a named owner. For tagging, CRM sync, and reporting, diffuse accountability is the silent killer. Watch for it. Next, version your metric dictionary. Every metric needs a definition, formula, owner, source, and effective date. When a definition changes, you need change control and an audit trail, because someone downstream will rebuild a report and get a different number. Then there's testing. Quarterly incrementality tests keep your attribution honest, and an annual measurement stack review keeps tools from piling up. Use this cadence when you want your numbers to survive scrutiny from finance and leadership. Coming up next, we'll examine common measurement failure modes and how to avoid them.
 gartner.cominnovationvista.commixpanel.com+22 min
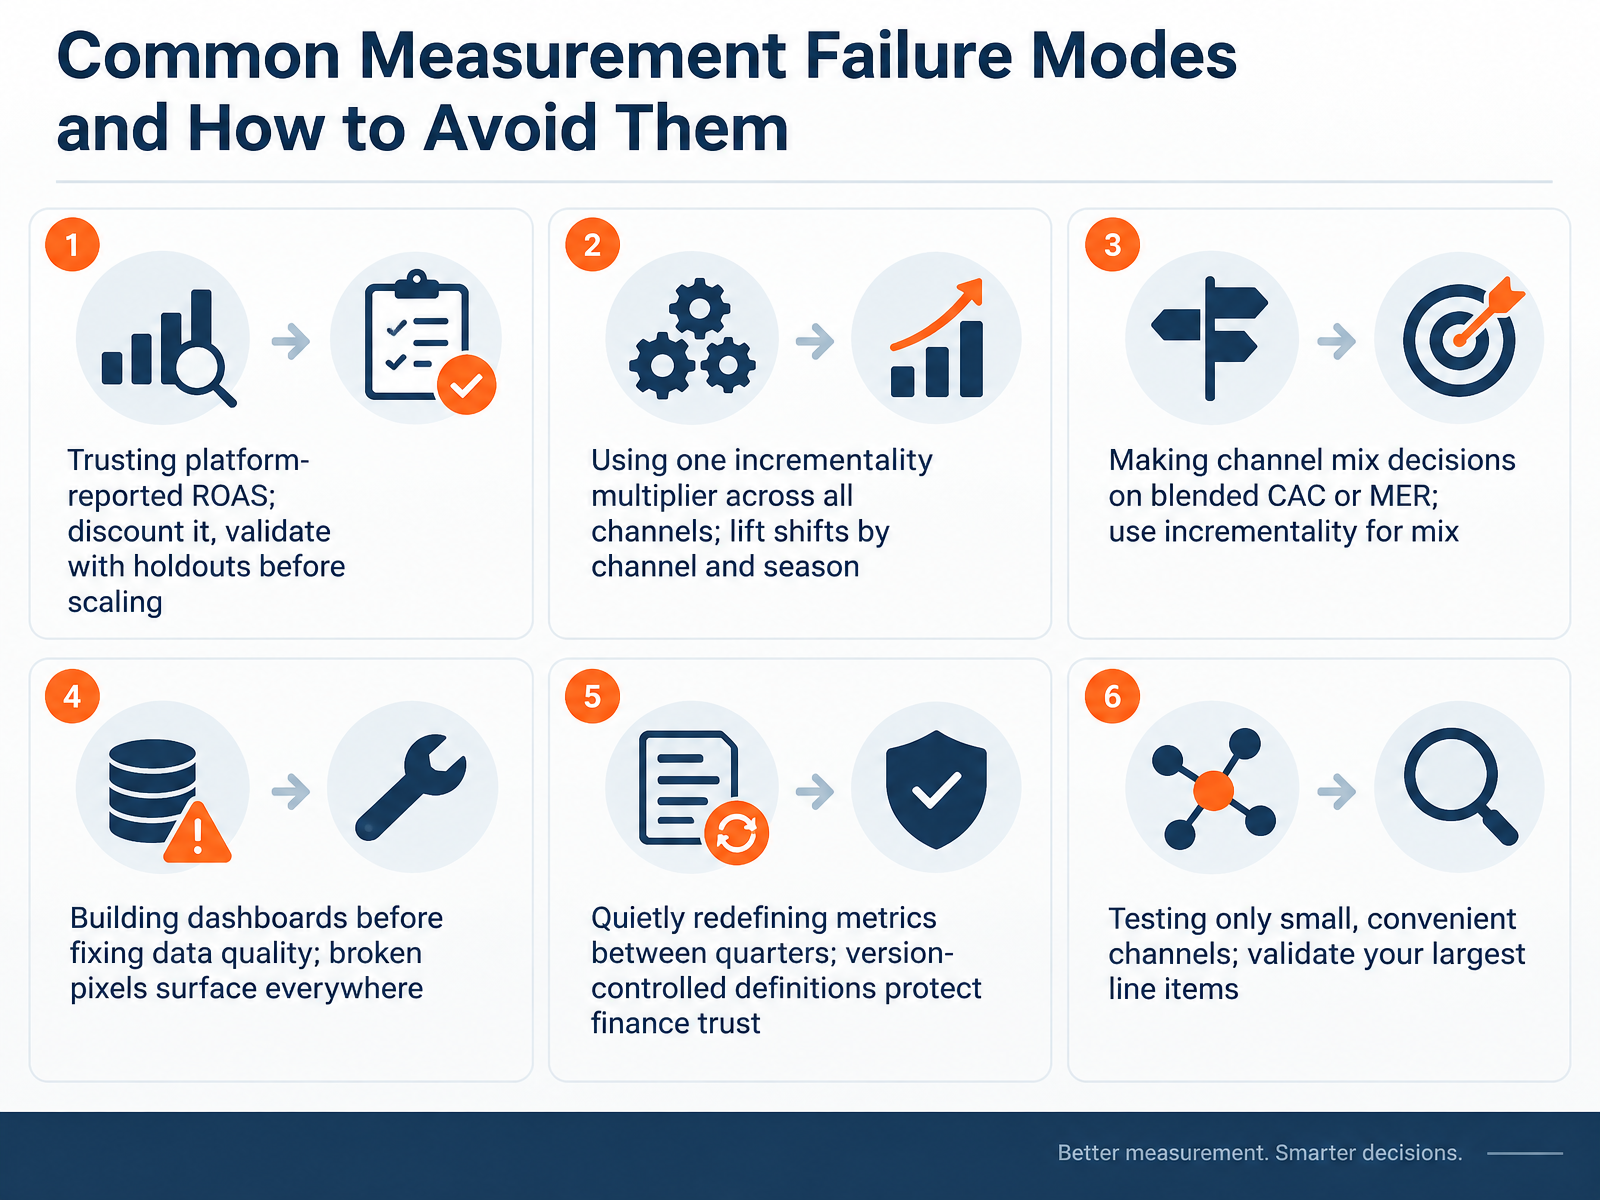
 - 12Common Measurement Failure Modes and How to Avoid ThemNow let's look at the failure modes that quietly erode measurement credibility, and how to avoid each one. First, platform-reported ROAS. It is inflated by attribution, so discount it. Use this when you are tuning a single channel, not when you decide the budget. Validate with holdouts before you scale. Next, one incrementality multiplier for every channel. Lift shifts by channel and by season, so refresh your multipliers quarterly. Watch for a multiplier that was calibrated in the first quarter and is still driving fourth-quarter decisions. Then, channel mix decisions on blended CAC or MER. Both are portfolio metrics. Blended CAC is total spend divided by new customers. MER is total revenue divided by total marketing spend. They tell you if the whole account is efficient, not which channel to cut. Use incrementality for mix shifts. Next, dashboards built before data quality. A broken pixel surfaces everywhere, so verify tracking before you visualize it. Watch for schema mismatches and missing events. Then, quietly redefining metrics between quarters. Version-control your definitions and log every change with an effective date. That single habit protects finance trust. Finally, testing only small, convenient channels. It is comfortable, but the largest line items carry the largest risk. Validate your biggest spend first. So put these together. Fix data quality, govern your definitions, and test where the money is. That sets up the next session, putting it to work, a ninety-day measurement action plan.
 eightx.coadmetrics.ioshopify.com+22 min
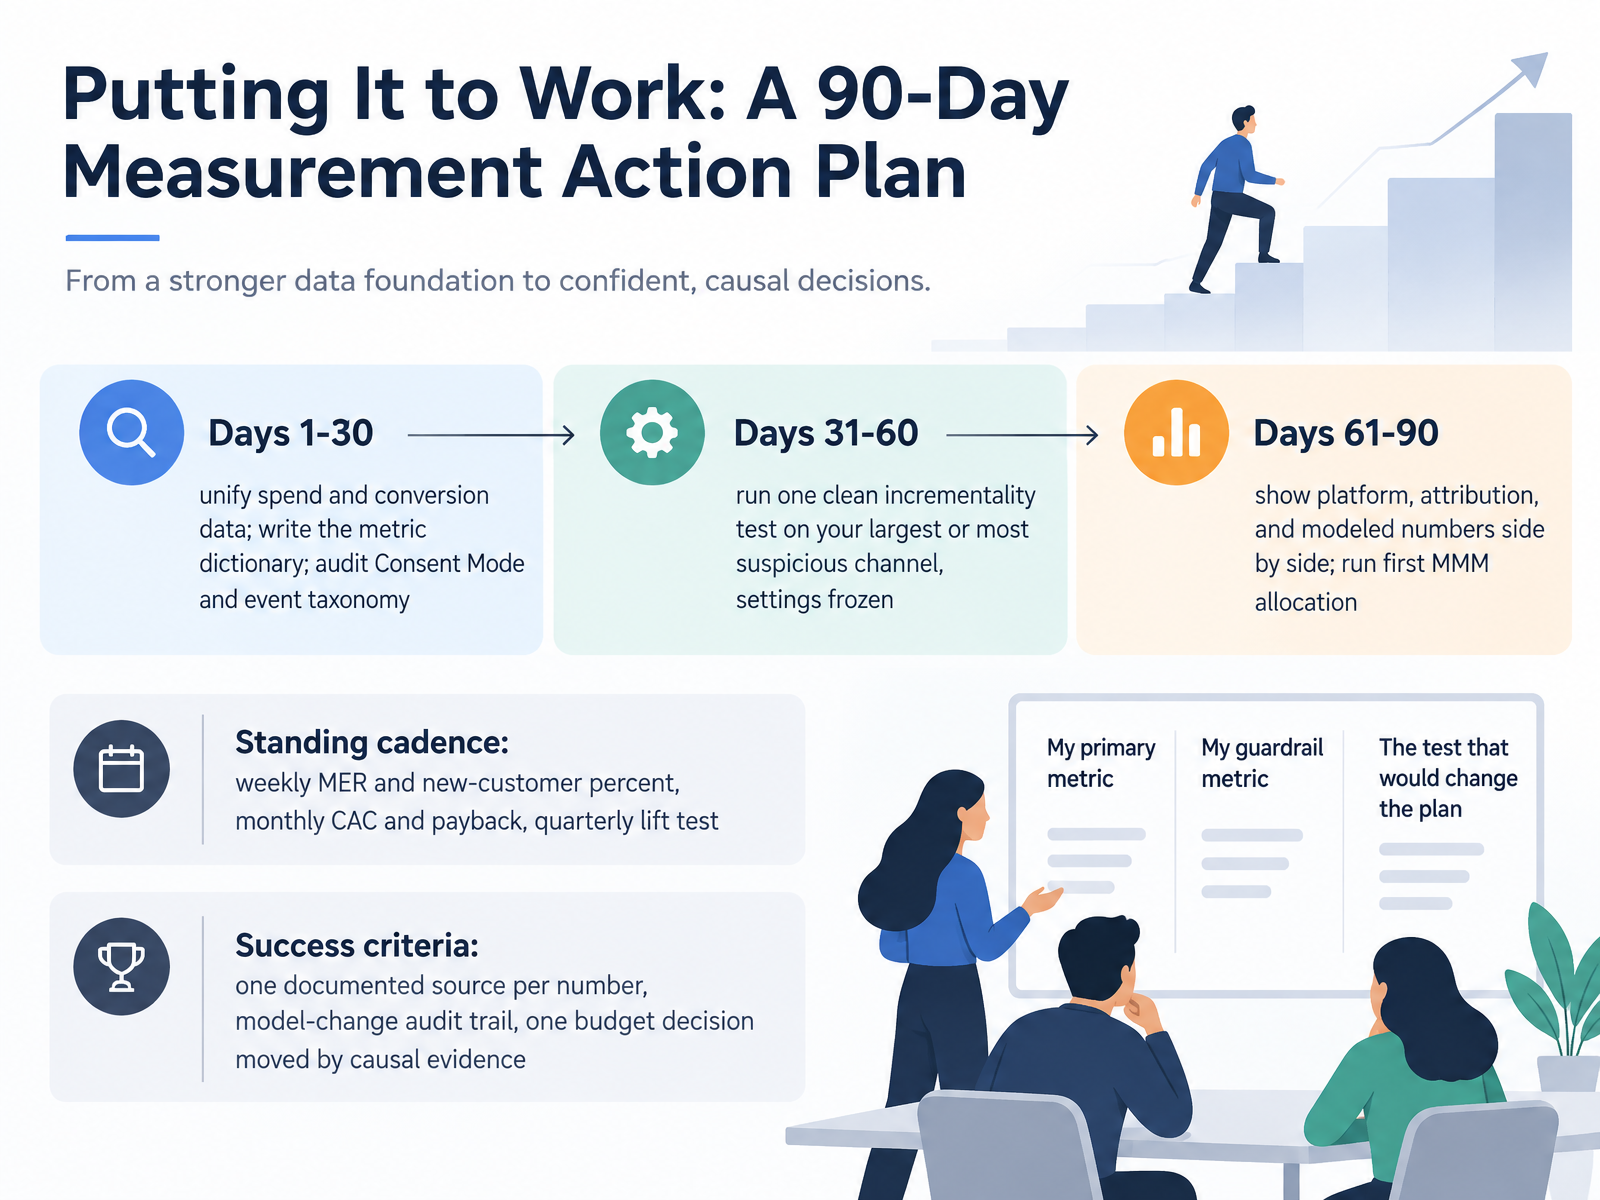
 - 13Putting It to Work: A 90-Day Measurement Action PlanLet us close with a plan you can start on Monday. Days one through thirty, unify spend and conversion data, write the metric dictionary, and audit Consent Mode and your event taxonomy. You cannot interpret numbers you cannot trace. Days thirty-one through sixty, run one clean incrementality test on your largest or most suspicious channel, with settings frozen. That means no bid, budget, or creative changes mid-test, or you contaminate the result. Days sixty-one through ninety, show platform, attribution, and modeled numbers side by side, then run your first marketing mix model allocation. Next, set the standing cadence. Weekly, read MER and new-customer percent. Monthly, review CAC and payback. Quarterly, run a lift test. So what counts as success? One documented source per number. A model-change audit trail. And at least one budget decision moved by causal evidence, not platform-reported ROAS. Start with the data foundation, prove one channel, then let the evidence move the money. Thank you for working through this course. You now have the framework, the metrics, and the cadence. Go make one defensible decision this quarter, and build from there.
 digitalapplied.comcometly.comthemarketingjuice.com+22 min
Take the deck with you
Download this course as a file — free, no sign-up needed.
- PDF handoutEvery slide page, ready to print or share.14 pages · 3.0 MBDownload
- Narrated PowerPointThe deck that presents itself — every slide carries the digital human's narration video.14 pages · 14.3 MBDownload
- PowerPoint slidesThe full deck as a .pptx — open it in PowerPoint, Keynote, or Google Slides.14 pages · 3.0 MBDownload
Free to use in your own training — please keep the PersonWise credit page at the end.
Have your own deck? Turn it into a course
Sources consulted
Web sources consulted while building this course.
- Maturity Model for Marketing Analytics - Gartner — gartner.com
- Our 2026 Mid-market Analytics Maturity Survey · Innovation Vista — innovationvista.com
- 2026 State of Digital Analytics: Benchmarks, analysis, and ... — mixpanel.com
- The 2026 Marketing Intelligence — funnel.io
- Marketing Analytics Maturity Model: 5 Levels Explained | Prooflytics — prooflytics.io
- MMM vs MTA vs Lift Tests 2026: The Measurement Matrix — digitalapplied.com
- Marketing Mix Modeling Multi Touch Attribution Guide — cometly.com
- Multi-Touch Attribution vs Marketing Mix Modeling — themarketingjuice.com
- Marketing Mix Modeling vs Attribution: Which Measurement Approach Is Right for Your Business? — Adspirer Blog — adspirer.com
- MMM vs Attribution vs Incrementality: 2026 Framework — studioideago.com
- ROAS vs MER vs Blended CAC: Which Metric Actually Matters in 2026 | Eightx — eightx.co
- KPIs, Benchmarks, and a Framework for Profitable DTC Growth — admetrics.io
- Marketing Efficiency Ratio: How To Calculate + Improve MER — shopify.com
- What Is Blended CAC? Formula & Benchmarks for Shopify | Karbon Analytics — karbonanalytics.com
- MER and CAC Reporting for Ecommerce Agencies — stanconsultingllc.com
- Google Consent Mode June 2026: What Changes for GA4 & Google Ads — datascale.de
- Consent Mode: What GA4 Measures and What It Models — sealmetrics.com
- The State of Google Consent Mode - Frankfurt Kurnit Klein & Selz — fkks.com
- What is Consent Mode v2, and how much data does it actually recover? — Amplio Data — ampliodata.io
- Consent Mode v2 & GA4 Reporting: How Behavioral Modeling Recovers Lost Data | CookieBeam — cookiebeam.com